> ## Documentation Index
> Fetch the complete documentation index at: https://docs.florists.digital/llms.txt
> Use this file to discover all available pages before exploring further.
# Insights
> Deeper analysis across staff, products, customers, orders, events, and delivery.
The **Insights** page goes deeper than the analytics overview. It breaks your data into tabs — staff, products, category sales, customers, orders, events, and delivery — so you can focus on one area at a time.
**This page covers features gated by Manager-tier permissions.** Managers and Admins have these by default; your administrator can adjust who has them in [Settings > Team](/settings/team).
 ## How it works
Set your date range and filters, press **Run**, and the page loads a series of **analytics blocks** — tables and charts grouped under tabs. Each tab focuses on one part of the business.
Some blocks have a small download button in their header for that block's data. For full data downloads across the shop, head to [Reports](/analytics/reports).
## Tabs
### Staff
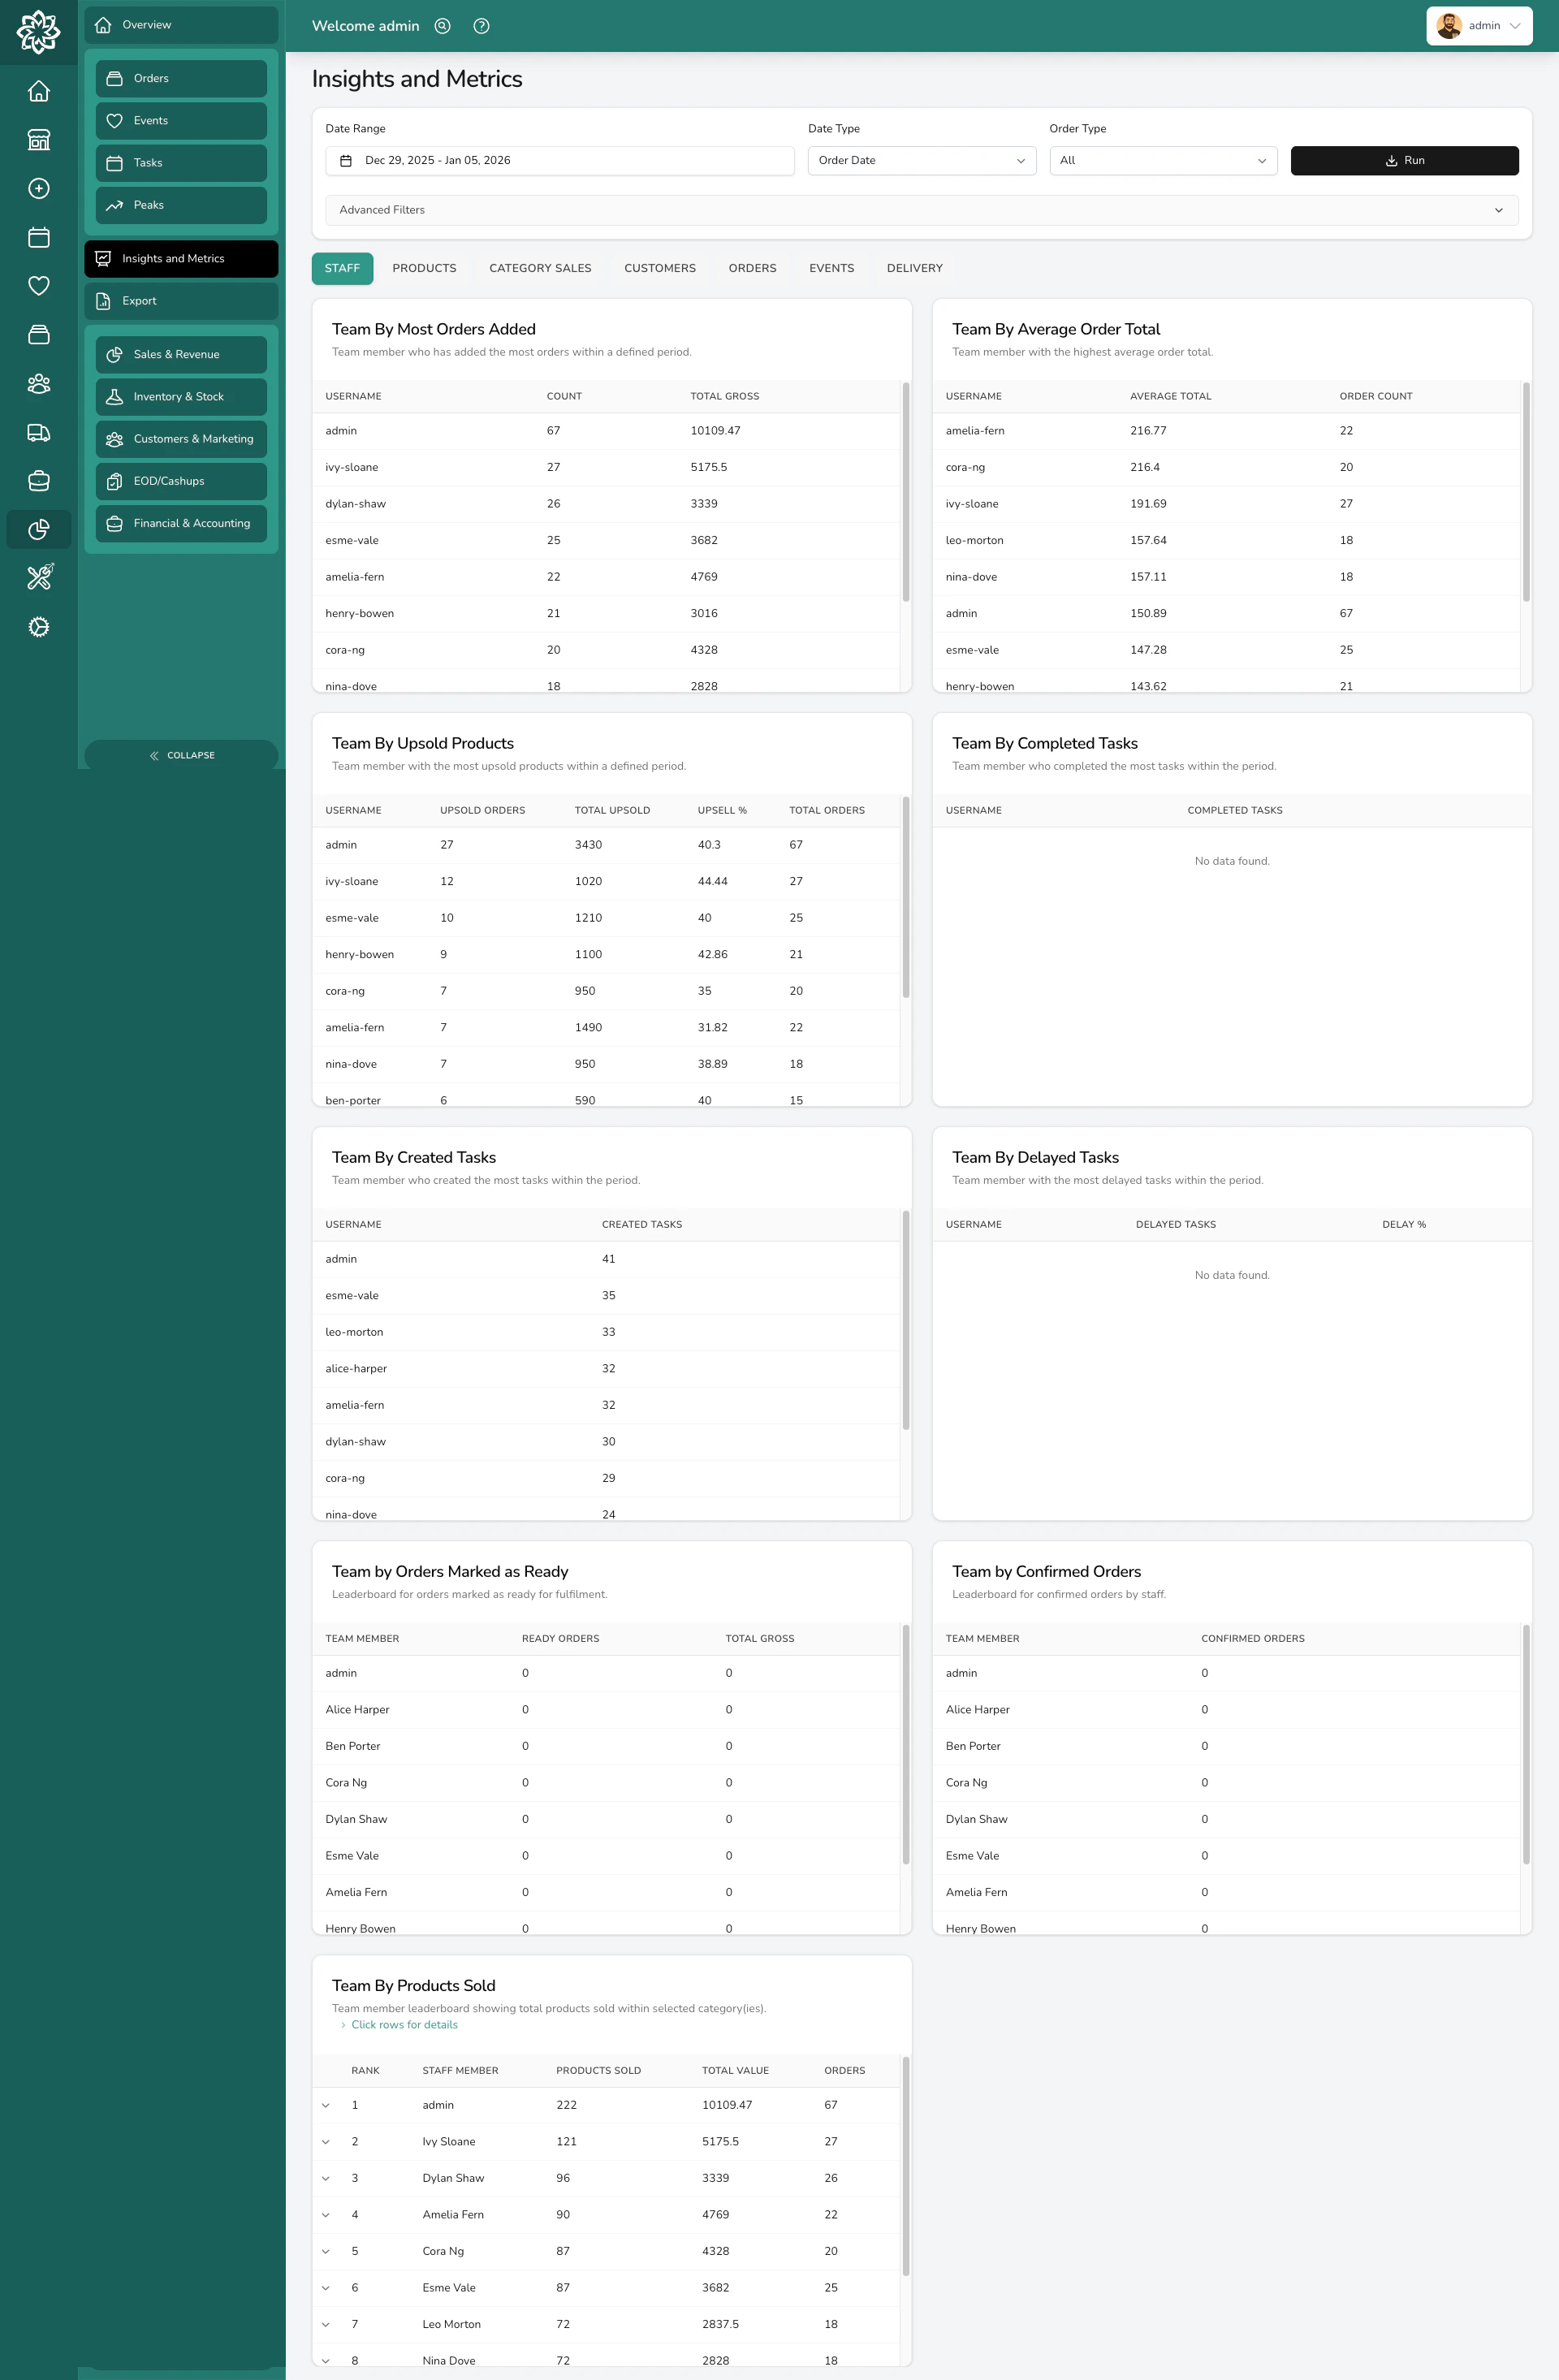
How your team is performing:
* **Team By Most Orders Added** — who's added the most orders, with total gross
* **Team By Average Order Total** — who's writing the highest-value orders on average
* **Team By Upsold Products** — who's adding upsell items (defined by your upsell category)
* **Team By Completed Tasks** — who's closed the most tasks in the period
* **Team By Created Tasks** — who's creating tasks
* **Team By Delayed Tasks** — tasks whose due date moved, with a delay percentage
* **Team by Confirmed Orders** — who's confirmed the most orders
* **Team By Products Sold** — products sold by each team member, with a per-product breakdown
* **Team By Orders Marked Ready** — who's marking orders ready for fulfilment
**Team By Products Sold** and **Team By Orders Marked Ready** expand on click to show a breakdown — products by name, or daily activity with times and sources.
### Products
What's selling and how it's bundled:
* **Most Ordered Products** — top 10 by order count, with total gross
* **Products Sold by Designer** — sales grouped by the designer named on each product
* **Frequently Bought Together** — product pairs that appear in the same order most often
## How it works
Set your date range and filters, press **Run**, and the page loads a series of **analytics blocks** — tables and charts grouped under tabs. Each tab focuses on one part of the business.
Some blocks have a small download button in their header for that block's data. For full data downloads across the shop, head to [Reports](/analytics/reports).
## Tabs
### Staff
How your team is performing:
* **Team By Most Orders Added** — who's added the most orders, with total gross
* **Team By Average Order Total** — who's writing the highest-value orders on average
* **Team By Upsold Products** — who's adding upsell items (defined by your upsell category)
* **Team By Completed Tasks** — who's closed the most tasks in the period
* **Team By Created Tasks** — who's creating tasks
* **Team By Delayed Tasks** — tasks whose due date moved, with a delay percentage
* **Team by Confirmed Orders** — who's confirmed the most orders
* **Team By Products Sold** — products sold by each team member, with a per-product breakdown
* **Team By Orders Marked Ready** — who's marking orders ready for fulfilment
**Team By Products Sold** and **Team By Orders Marked Ready** expand on click to show a breakdown — products by name, or daily activity with times and sources.
### Products
What's selling and how it's bundled:
* **Most Ordered Products** — top 10 by order count, with total gross
* **Products Sold by Designer** — sales grouped by the designer named on each product
* **Frequently Bought Together** — product pairs that appear in the same order most often
 ### Category sales
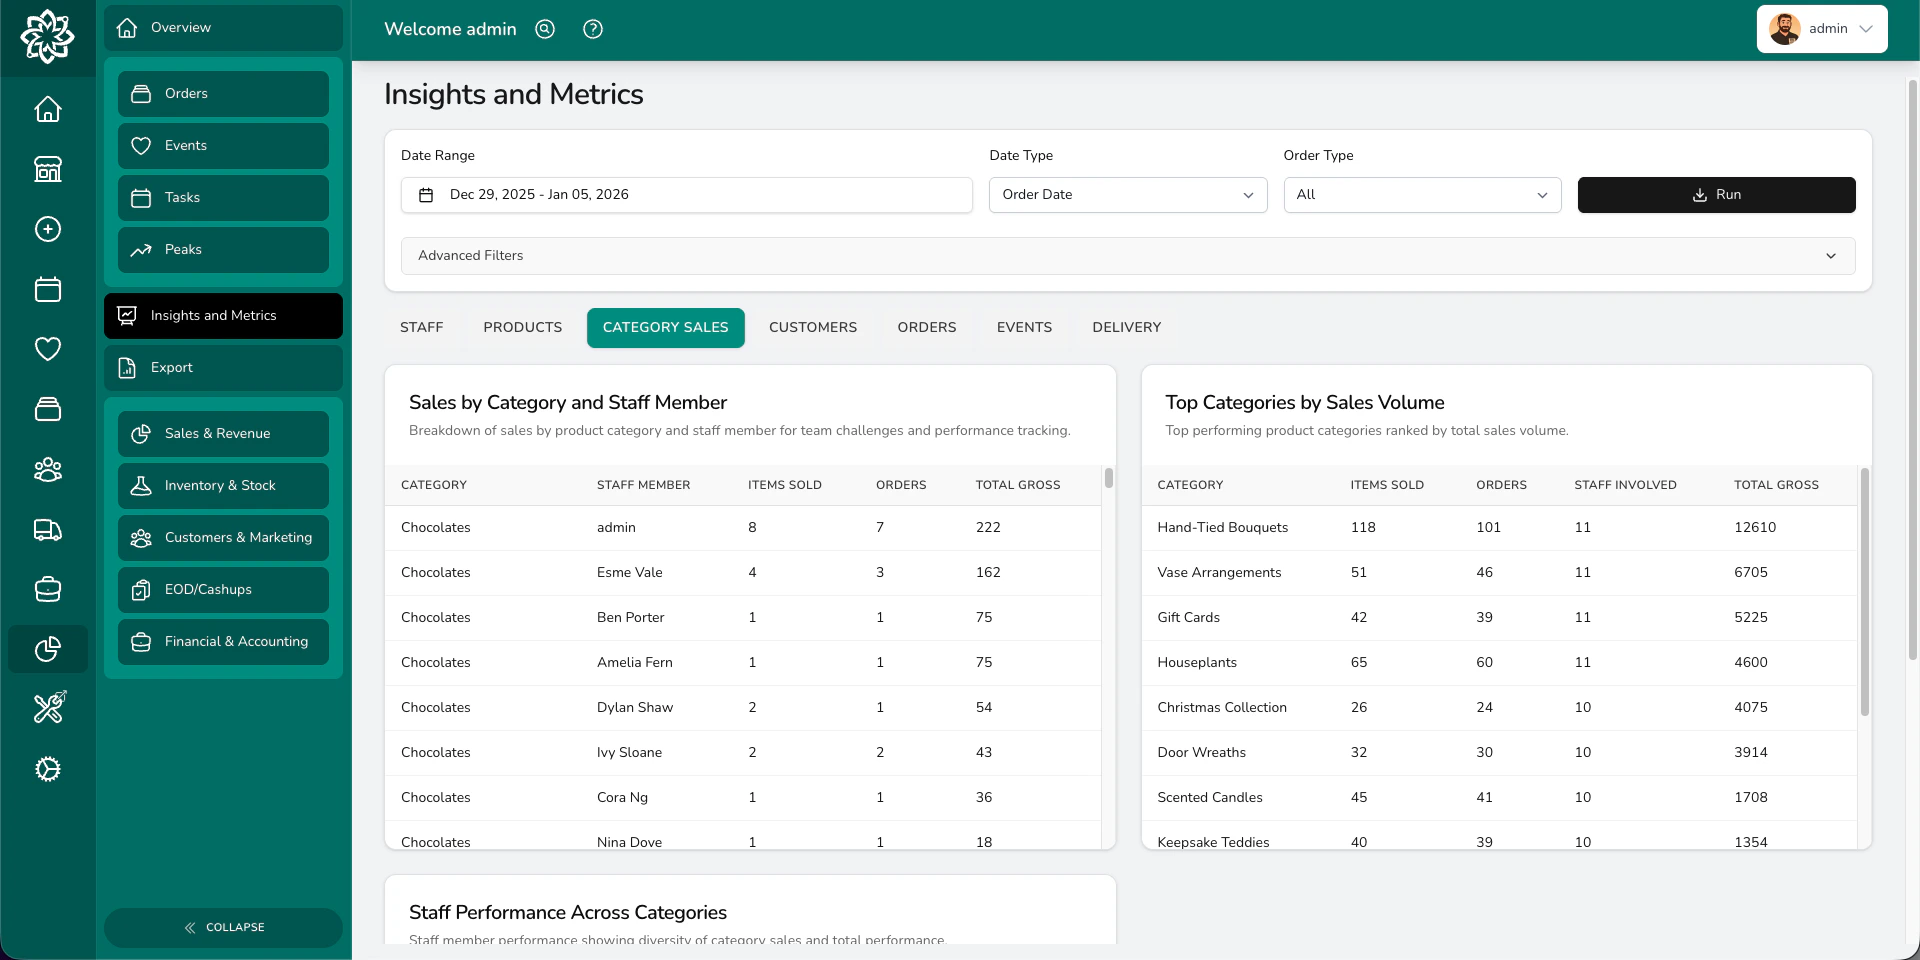
Sales broken down by product category:
* **Sales by Category and Staff Member** — items, orders, and gross per category per staff member
* **Top Categories by Sales Volume** — top 15 categories by gross
* **Staff Performance Across Categories** — how many categories each team member sold from
### Customers
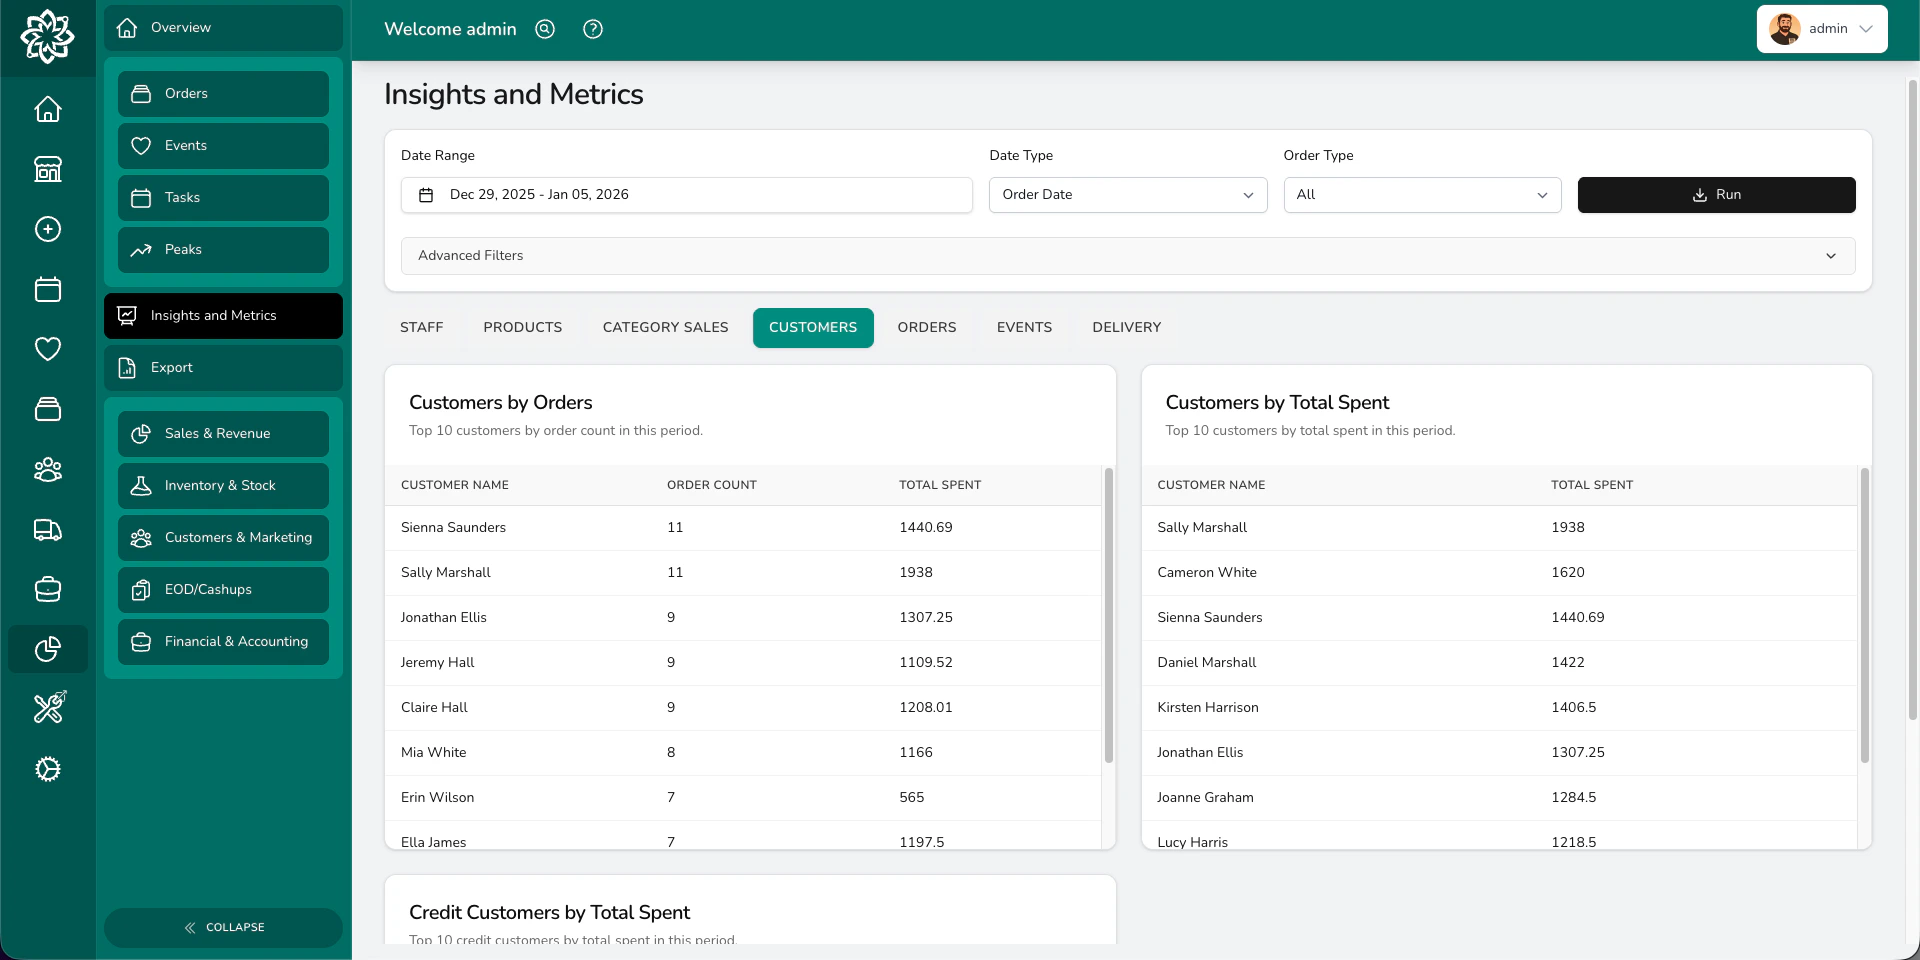
Three leaderboards covering who's buying:
* **Customers by Orders** — top 10 by order count, with total spent
* **Customers by Total Spent** — top 10 by spend across the period
* **Credit Customers by Total Spent** — top 10 account customers by spend
### Category sales
Sales broken down by product category:
* **Sales by Category and Staff Member** — items, orders, and gross per category per staff member
* **Top Categories by Sales Volume** — top 15 categories by gross
* **Staff Performance Across Categories** — how many categories each team member sold from
### Customers
Three leaderboards covering who's buying:
* **Customers by Orders** — top 10 by order count, with total spent
* **Customers by Total Spent** — top 10 by spend across the period
* **Credit Customers by Total Spent** — top 10 account customers by spend
 ### Orders
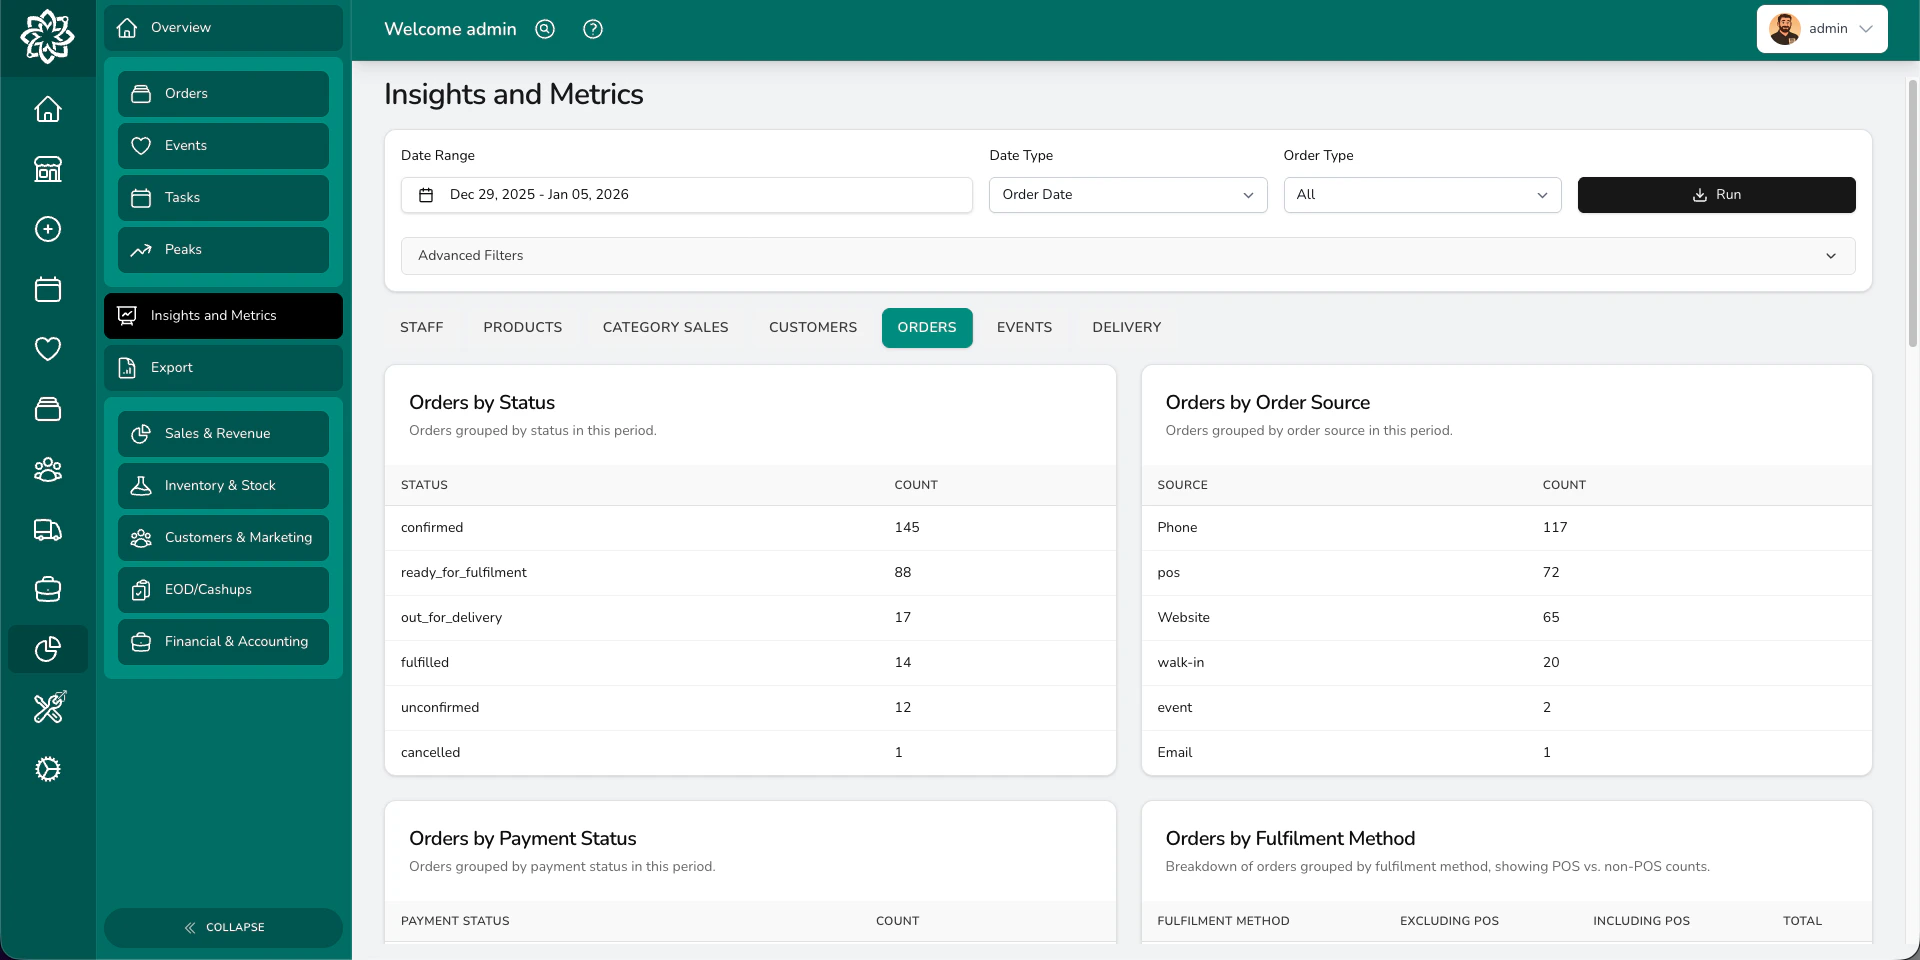
A wide breakdown of order data:
* Counts grouped by **status**, **order source**, **payment status**, **fulfilment method**, **order type**, **occasion**, **payment method**, **fulfilment date**, **delivery slot**, and **integration**
* **Delivery Orders by Postcode Area** (UK shops only)
* **Order Processing Time by Stage** — average time between status changes
* **Sales by Occasion** with year-on-year comparison
* **Occasion Sales by Month** — monthly trend for the top occasions
* **Payment Aging Analysis** — outstanding orders grouped by age bucket
* **Orders Marked Ready** charts — daily trend, by hour, by source, and top 10 staff comparison
### Orders
A wide breakdown of order data:
* Counts grouped by **status**, **order source**, **payment status**, **fulfilment method**, **order type**, **occasion**, **payment method**, **fulfilment date**, **delivery slot**, and **integration**
* **Delivery Orders by Postcode Area** (UK shops only)
* **Order Processing Time by Stage** — average time between status changes
* **Sales by Occasion** with year-on-year comparison
* **Occasion Sales by Month** — monthly trend for the top occasions
* **Payment Aging Analysis** — outstanding orders grouped by age bucket
* **Orders Marked Ready** charts — daily trend, by hour, by source, and top 10 staff comparison
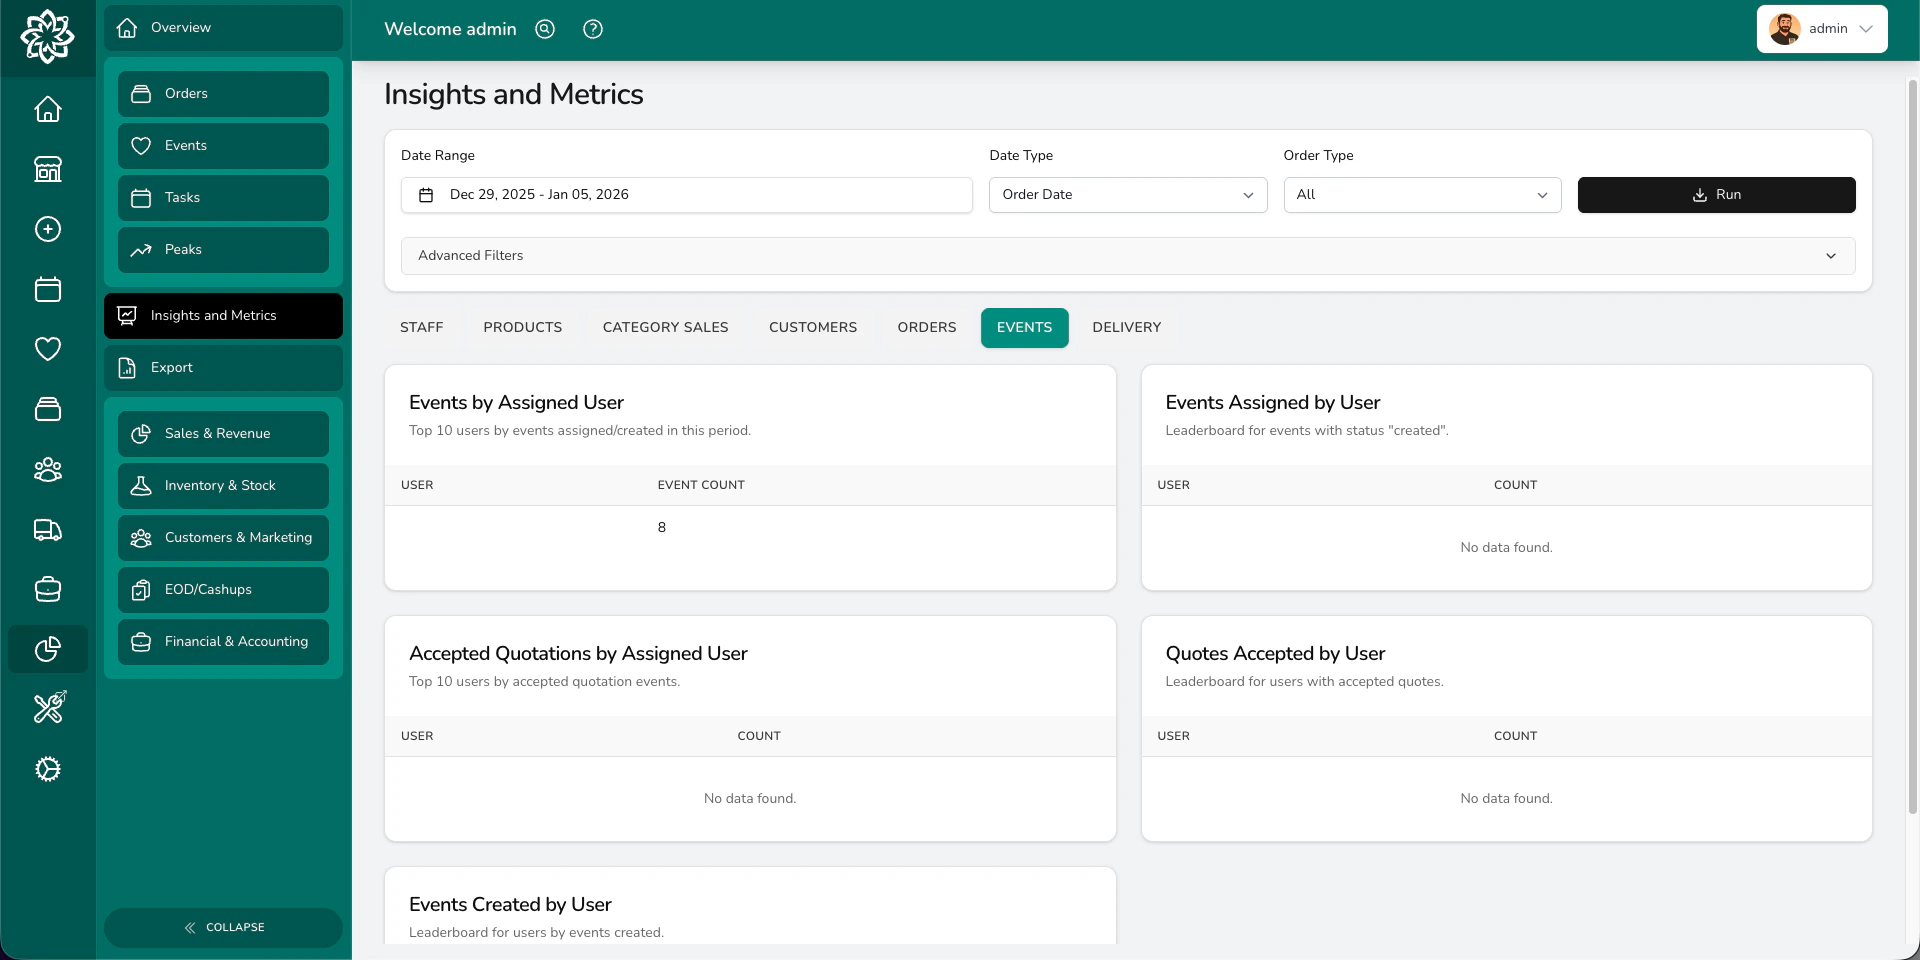
 ### Events
Your wedding and event pipeline:
* Leaderboards for **events created**, **events assigned**, and **quotes accepted** by user
* **Events by Venue** — useful for spotting where to exhibit at wedding fairs
* **Events by Marketing Source** — where leads come from
* **Events by Type** — which event categories you run most
* **Event Quote Conversion Funnel** — how events move from draft to completed, with average days in each stage
* **Quote Conversion Rate Over Time** — monthly conversion trend
### Events
Your wedding and event pipeline:
* Leaderboards for **events created**, **events assigned**, and **quotes accepted** by user
* **Events by Venue** — useful for spotting where to exhibit at wedding fairs
* **Events by Marketing Source** — where leads come from
* **Events by Type** — which event categories you run most
* **Event Quote Conversion Funnel** — how events move from draft to completed, with average days in each stage
* **Quote Conversion Rate Over Time** — monthly conversion trend
 ### Delivery
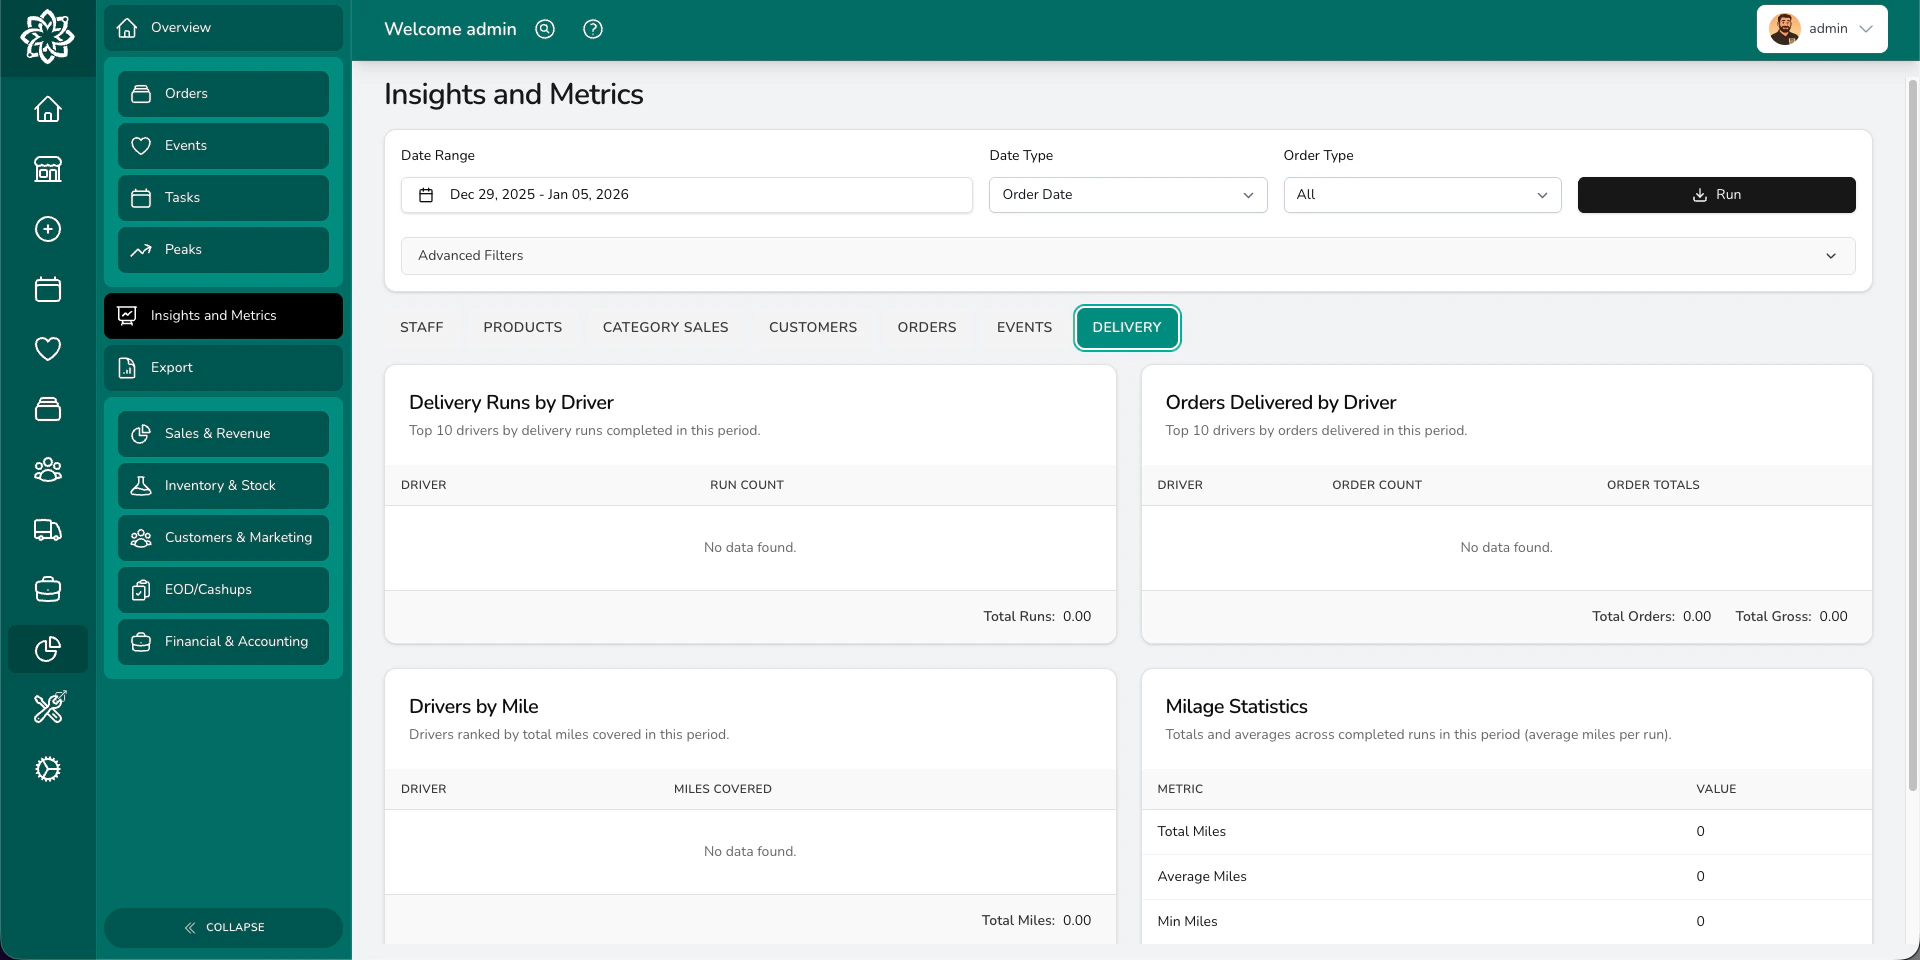
How your runs and drivers are performing:
* **Delivery Runs by Driver** — top 10 drivers by completed runs
* **Orders Delivered by Driver** — orders and gross delivered per driver
* **Drivers by Mile** — total miles per driver
* **Milage Statistics** — totals, averages, fees, and average deliveries per run
* **Driver Performance Summary** — runs, stops, average duration, and time per stop
* **Daily Delivery Completions** — runs completed per day
If **Punctuality Monitoring** is turned on in [delivery settings](/daily-operations/delivery-history#punctuality), an extra block appears:
* **Driver Punctuality** — average score, on-time, late, and very late percentages per driver
Delivery analytics only include data from October 2025 onwards. Earlier runs from the legacy driver system aren't included.
### Delivery
How your runs and drivers are performing:
* **Delivery Runs by Driver** — top 10 drivers by completed runs
* **Orders Delivered by Driver** — orders and gross delivered per driver
* **Drivers by Mile** — total miles per driver
* **Milage Statistics** — totals, averages, fees, and average deliveries per run
* **Driver Performance Summary** — runs, stops, average duration, and time per stop
* **Daily Delivery Completions** — runs completed per day
If **Punctuality Monitoring** is turned on in [delivery settings](/daily-operations/delivery-history#punctuality), an extra block appears:
* **Driver Punctuality** — average score, on-time, late, and very late percentages per driver
Delivery analytics only include data from October 2025 onwards. Earlier runs from the legacy driver system aren't included.
 ## Filtering
Set the filters at the top of the page before pressing **Run**.
* **Date Range** — pick a preset (Today, Last 7 days, Last 30 days, This month, Last month, This year, Last year) or choose custom dates
* **Date Type** — Order Date or Fulfilment Date
* **Order Type** — All, Gift, Funeral, Corporate, or Event
Open **Advanced Filters** for:
* **Product Categories** — pick one or more, with an option to include subcategories
* **Locations** — pick one shop or several
* **Integrations** — limit to specific connected integrations
* **Order Sources** — limit to specific order sources, or include orders with no source
## Common questions
A few blocks have a small download button in their header — **Team By Orders Marked Ready**, **Customers by Orders**, **Customers by Total Spent**, and **Driver Punctuality**. For full data downloads, see [Reports](/analytics/reports).
If a block has no data for your filters and date range, it stays empty. Try widening the date range or removing filters.
**Insights** are on-screen tables and charts. **Reports** are downloadable spreadsheets you can open in Excel or Google Sheets.
The Driver Punctuality block only appears if **Punctuality Monitoring** is turned on. See [Delivery History](/daily-operations/delivery-history#punctuality) for how to enable it.
## What's next?
See the high-level overview of your shop's performance.
Compare your busiest periods year-on-year.
Download detailed reports as spreadsheets.
Review past runs, punctuality, and driver performance.
## Filtering
Set the filters at the top of the page before pressing **Run**.
* **Date Range** — pick a preset (Today, Last 7 days, Last 30 days, This month, Last month, This year, Last year) or choose custom dates
* **Date Type** — Order Date or Fulfilment Date
* **Order Type** — All, Gift, Funeral, Corporate, or Event
Open **Advanced Filters** for:
* **Product Categories** — pick one or more, with an option to include subcategories
* **Locations** — pick one shop or several
* **Integrations** — limit to specific connected integrations
* **Order Sources** — limit to specific order sources, or include orders with no source
## Common questions
A few blocks have a small download button in their header — **Team By Orders Marked Ready**, **Customers by Orders**, **Customers by Total Spent**, and **Driver Punctuality**. For full data downloads, see [Reports](/analytics/reports).
If a block has no data for your filters and date range, it stays empty. Try widening the date range or removing filters.
**Insights** are on-screen tables and charts. **Reports** are downloadable spreadsheets you can open in Excel or Google Sheets.
The Driver Punctuality block only appears if **Punctuality Monitoring** is turned on. See [Delivery History](/daily-operations/delivery-history#punctuality) for how to enable it.
## What's next?
See the high-level overview of your shop's performance.
Compare your busiest periods year-on-year.
Download detailed reports as spreadsheets.
Review past runs, punctuality, and driver performance.