> ## Documentation Index
> Fetch the complete documentation index at: https://docs.florists.digital/llms.txt
> Use this file to discover all available pages before exploring further.
# Analytics
> See how your shop is performing with charts, metrics, and trends.
**Analytics** is where you go to understand how your business is doing. It shows your revenue, order volumes, product performance, customer trends, and seasonal patterns, refreshed each time you open the page.
**This page covers features gated by Manager-tier permissions.** Managers and Admins have these by default; your administrator can adjust who has them in [Settings > Team](/settings/team).
Your dashboard shows only the analytics views included with your plan.
 ## What you'll find
The overview is split into three views, each giving you a different angle on your business.
### Orders
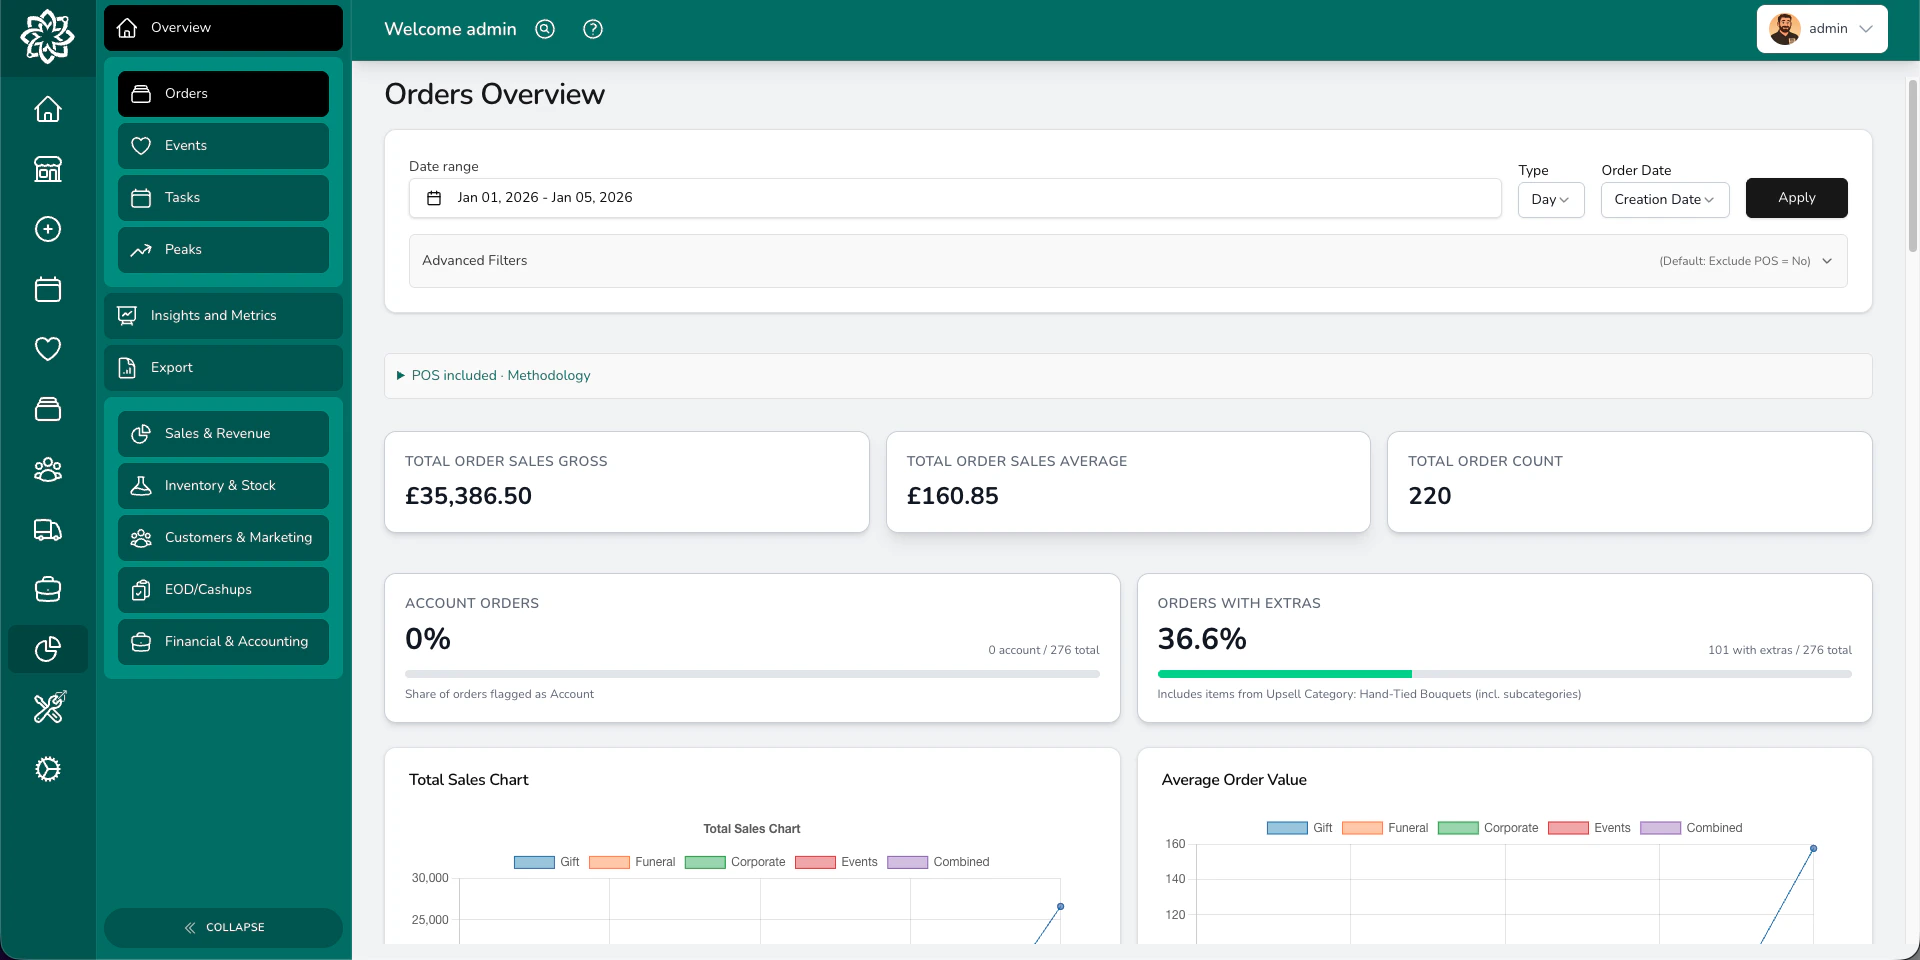
The **Orders** view shows your sales at a glance: total revenue, order count, and average order value. View trends by day or month, switch between order date and fulfilment date, and break things down by occasion, source, fulfilment method, or payment method.
Use this to answer questions like:
* How much did we take this week?
* Are customers spending more or less than last month?
* Which occasions bring in the most revenue?
* Where are our orders coming from: website, phone, or walk-in?
### Events
The **Events** view tracks your weddings, funerals, and corporate events. It shows event counts by month, expected revenue against payments received, and average values per event.
Use this to answer:
* How many events are booked for the coming months?
* How does our expected event revenue compare to what we've collected?
* What's the average paid revenue per event?
### Tasks
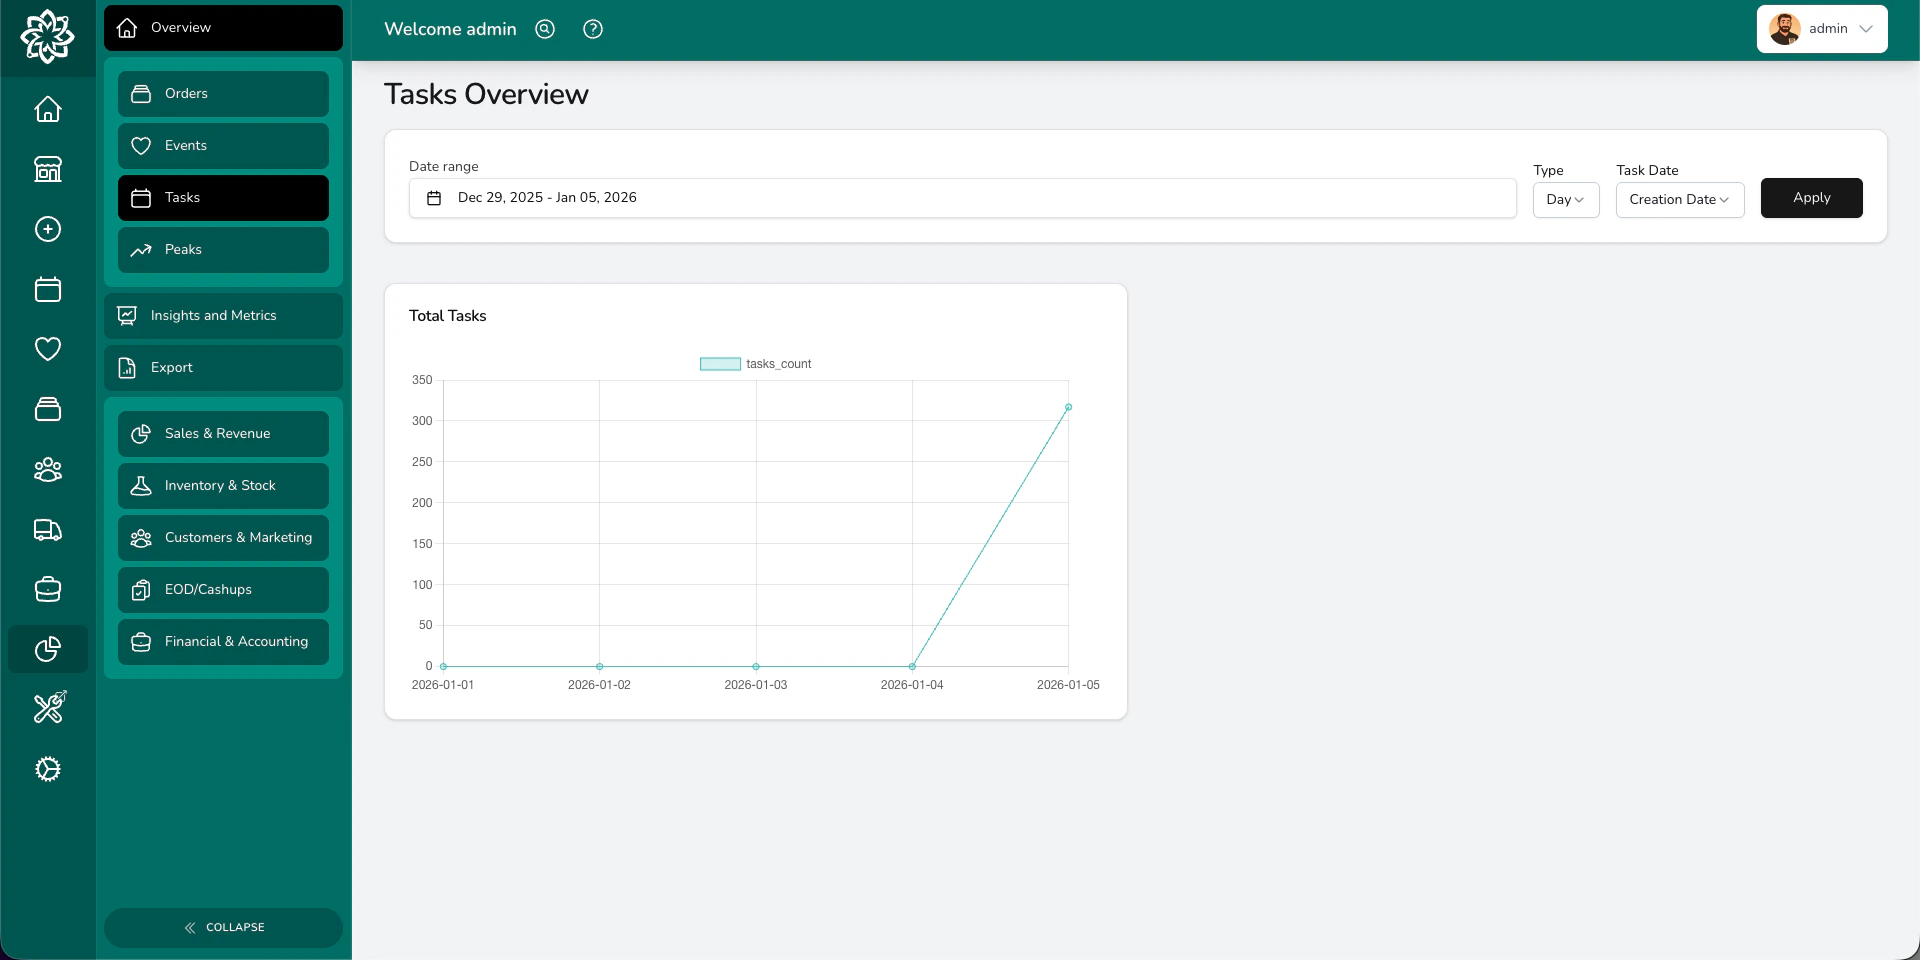
The **Tasks** view shows task volumes over time, so you can see how many tasks your team is completing each day or month. Useful for understanding workload patterns and planning staffing.
## What you'll find
The overview is split into three views, each giving you a different angle on your business.
### Orders
The **Orders** view shows your sales at a glance: total revenue, order count, and average order value. View trends by day or month, switch between order date and fulfilment date, and break things down by occasion, source, fulfilment method, or payment method.
Use this to answer questions like:
* How much did we take this week?
* Are customers spending more or less than last month?
* Which occasions bring in the most revenue?
* Where are our orders coming from: website, phone, or walk-in?
### Events
The **Events** view tracks your weddings, funerals, and corporate events. It shows event counts by month, expected revenue against payments received, and average values per event.
Use this to answer:
* How many events are booked for the coming months?
* How does our expected event revenue compare to what we've collected?
* What's the average paid revenue per event?
### Tasks
The **Tasks** view shows task volumes over time, so you can see how many tasks your team is completing each day or month. Useful for understanding workload patterns and planning staffing.
 For deeper geographic, peak-period, and category analysis, see the other Analytics pages listed in [Going deeper](#going-deeper).
## Filtering your data
Each view has its own filters. Every view lets you pick a **date range**; the other filters depend on what makes sense for that area.
* **Orders** — date range, daily or monthly view, switch between creation date and fulfilment date, choose which locations to include, and exclude point of sale (POS) walk-in till sales to see only online and phone orders.
* **Events** — date range, daily or monthly view, and switch between creation date and event date.
* **Tasks** — date range, and switch between creation date, due date, or completion date.
## Going deeper
Beyond the overview, Analytics has more places to dig in:
Deeper analysis across staff performance, products, customers, orders, events, and delivery. Filter by category and drill into the detail.
Compare your busiest periods (Valentine's, Mother's Day, Christmas) year-on-year and forecast next year.
See where your orders are coming from by town, postcode area, or county.
Generate and download detailed reports across sales, inventory, customers, financials, and end of day. Export as Excel or CSV.
## Common questions
Your analytics include all data from when you started using Digital Florists. There's no limit on historical data.
Numbers refresh each time you load the page, picking up new orders, events, and tasks as they're recorded.
Analytics require the **Analytics (View)** permission. Managers and Admins have this by default; your administrator can adjust who has it in [Settings > Team](/settings/team).
Yes. Head to [Reports](/analytics/reports) to generate downloadable spreadsheets.
## What's next?
Compare your busiest periods year-on-year and plan ahead.
Drill into staff, product, and customer performance.
Download detailed reports for every area of your business.
Reconcile your till and close out the day.
For deeper geographic, peak-period, and category analysis, see the other Analytics pages listed in [Going deeper](#going-deeper).
## Filtering your data
Each view has its own filters. Every view lets you pick a **date range**; the other filters depend on what makes sense for that area.
* **Orders** — date range, daily or monthly view, switch between creation date and fulfilment date, choose which locations to include, and exclude point of sale (POS) walk-in till sales to see only online and phone orders.
* **Events** — date range, daily or monthly view, and switch between creation date and event date.
* **Tasks** — date range, and switch between creation date, due date, or completion date.
## Going deeper
Beyond the overview, Analytics has more places to dig in:
Deeper analysis across staff performance, products, customers, orders, events, and delivery. Filter by category and drill into the detail.
Compare your busiest periods (Valentine's, Mother's Day, Christmas) year-on-year and forecast next year.
See where your orders are coming from by town, postcode area, or county.
Generate and download detailed reports across sales, inventory, customers, financials, and end of day. Export as Excel or CSV.
## Common questions
Your analytics include all data from when you started using Digital Florists. There's no limit on historical data.
Numbers refresh each time you load the page, picking up new orders, events, and tasks as they're recorded.
Analytics require the **Analytics (View)** permission. Managers and Admins have this by default; your administrator can adjust who has it in [Settings > Team](/settings/team).
Yes. Head to [Reports](/analytics/reports) to generate downloadable spreadsheets.
## What's next?
Compare your busiest periods year-on-year and plan ahead.
Drill into staff, product, and customer performance.
Download detailed reports for every area of your business.
Reconcile your till and close out the day.