> ## Documentation Index
> Fetch the complete documentation index at: https://docs.florists.digital/llms.txt
> Use this file to discover all available pages before exploring further.
# Peak Reporting
> Compare your busiest periods year-on-year and plan for what's coming.
Floristry is seasonal. Valentine's Day, Mother's Day, and Christmas are some of your biggest weeks of the year. **Peak reporting** helps you compare these busy periods year-on-year so you can plan stock, staffing, and logistics ahead of time.
**This page covers features gated by Manager-tier permissions.** Managers and Admins have these by default; your administrator can adjust who has them in [Settings > Team](/settings/team).
## How it works
Pick a **period** to analyse and a **comparison** to measure it against. The period is either a predefined peak or a custom date range. The comparison is the previous year, the previous period, custom dates, or nothing.
### Predefined peaks
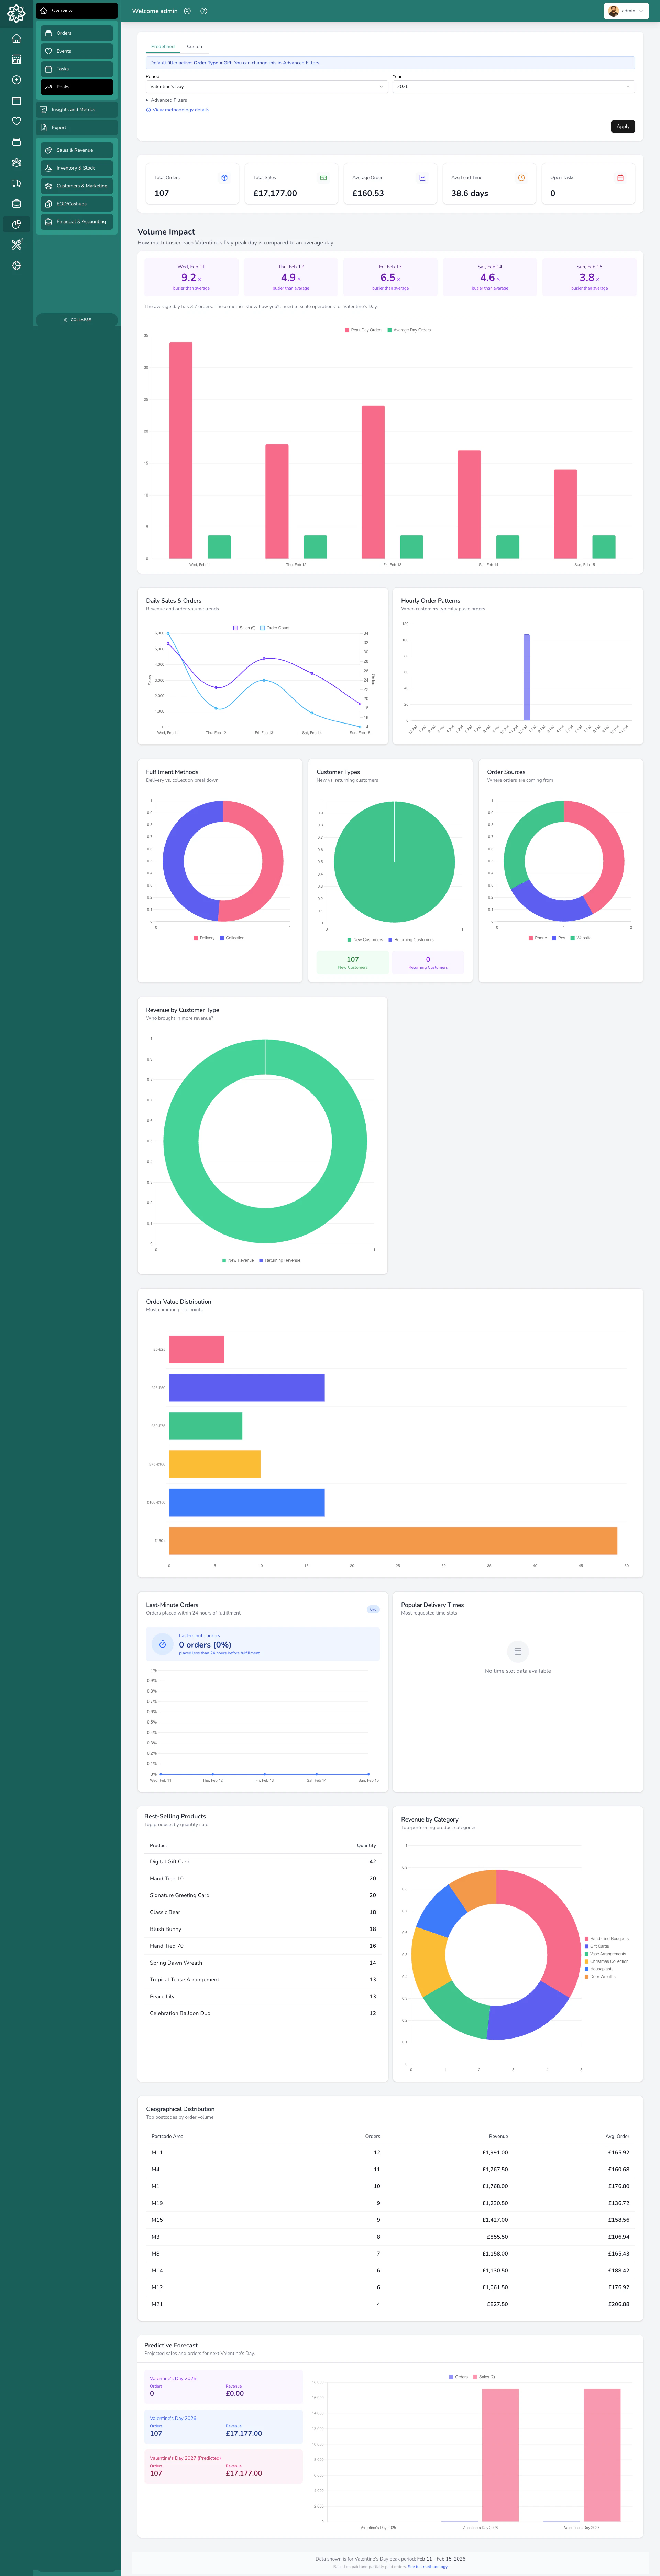
Select a peak period and a year, and your dashboard shows you everything that happened during that window: orders, revenue, products sold, customer behaviour, and more. It also compares each day against your average daily performance for the rest of the year, so you can see how much busier you were.
Covers the major UK and international floral peaks: Valentine's Day, International Women's Day, Mother's Day, International Mother's Day, Father's Day, Easter, Thanksgiving, and Christmas. Dates are calculated for you each year.
### Custom comparison
Pick **Custom dates...** as the period and set a date range. Then set **Compare against** to **Same dates last year** (the default), **Previous period**, **Custom dates**, or **No comparison**. Named peaks can be compared too, with the same options minus **Previous period** (since the 5 days before a named peak isn't a useful comparison).
This is useful for comparing:
* This December vs last December
* A promotional week vs a normal week
* Any two periods you want to measure against each other
## What you'll see
### Summary cards
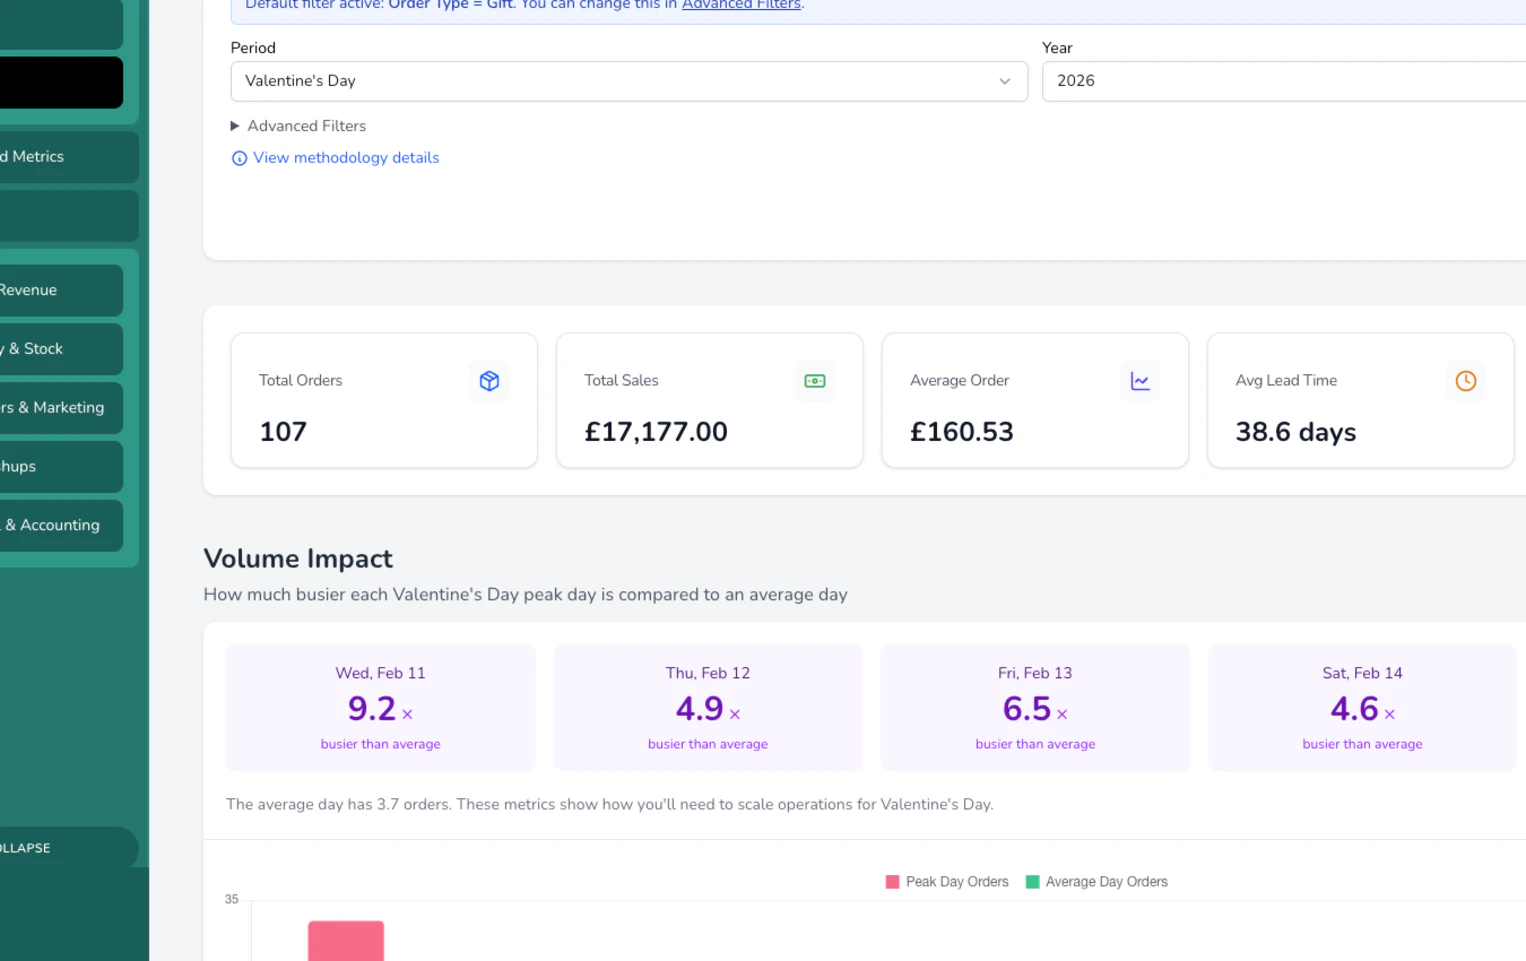
At the top, you get the headline numbers for your selected period.
| Metric | What it shows |
| --------------------- | ------------------------------------------------------------------------------------------------- |
| **Total orders** | How many orders you fulfilled |
| **Total sales** | Your revenue for the period |
| **Average order** | How much each customer spent on average |
| **Average lead time** | How many days ahead customers placed their orders, alongside the percentage of last-minute orders |
| **Open tasks** | Tasks due during the period that haven't been completed yet |
### Volume impact
This shows how much busier each day of the peak was compared to a normal day. You'll see ratios like "2.5x busier than average", meaning you handled two and a half times your usual daily volume.
The average is calculated from the rest of the year, excluding the peak period itself, so peak days are compared against your typical day rather than against themselves.
### Charts and breakdowns
Peak reporting is split across four tabs. Each tab focuses on a different angle of the same peak window.
#### Overview
| Chart | What it shows |
| ------------------------- | ---------------------------------------------------------------------- |
| **Daily Sales & Orders** | Revenue and volume trends across each day of the peak |
| **Hourly Order Patterns** | When during the day customers are placing orders (useful for staffing) |
#### Customers & Sales
| Chart | What it shows |
| ---------------------------- | -------------------------------------------------------------- |
| **Fulfilment Methods** | How many went out for delivery vs were collected in-store |
| **Customer Types** | New customers vs returning customers |
| **Order Sources** | Where orders came from, based on the sources you've configured |
| **Revenue by Customer Type** | How much each customer group spent |
| **Order Value Distribution** | How your orders break down across price bands |
| **Last-Minute Orders** | The percentage placed within 24 hours of fulfilment |
| **Popular Delivery Times** | Which time slots customers requested most |
#### Products & Workload
| Chart | What it shows |
| ---------------------------- | ---------------------------------------------------------------- |
| **Best-Selling Products** | Your top products by quantity during the peak |
| **Revenue by Category** | Which product categories performed best |
| **Workload & Item Analysis** | How multi-item orders affect the real volume of stems to prepare |
#### Geography & Forecast
| Chart | What it shows |
| ----------------------------- | --------------------------------------------------------------- |
| **Geographical Distribution** | Top postcodes by order volume, revenue, and average order value |
| **Forecast** | A three-year projection for predefined peaks (see below) |
## Forecasting
For predefined peaks, Digital Florists shows a **forecast** for the next year based on your year-on-year growth. You'll see three bars side by side.
| Bar | What it shows |
| ----------------- | -------------------------------------------- |
| **Previous year** | What you did last time |
| **Current year** | What you did this time |
| **Forecast** | What Digital Florists projects for next year |
The forecast compares this year against last year, dampens the growth rate, and caps the maximum projected growth so a single big year doesn't skew the next one. If you don't have data for the previous year, the growth rate falls back to zero and the forecast matches this year.
This helps you plan how many stems to order, how many drivers to schedule, and how much stock to carry.
If you sold 500 red roses last Valentine's Day, the forecast helps you estimate whether to order 500, 550, or 600 this year, based on your actual growth trend rather than guesswork.
Forecasts only appear on predefined peaks. Custom comparisons don't include a forecast because arbitrary date ranges don't have a natural "next year".
## Filtering
You can refine your peak analysis with several filters.
| Filter | What it does |
| ------------------------- | -------------------------------------------------------------------------------------------------------------- |
| **Locations** | View a specific shop or all locations |
| **Order Types** | Filter by gift, funeral, corporate, or event orders. Defaults to gift only |
| **Order Sources** | Filter by where orders came from |
| **Integrations** | Filter by connected platforms |
| **Include Unpaid Orders** | Off by default. Paid and partially paid orders are always included; turn this on to also include unpaid orders |
| **Exclude POS Orders** | Off by default. Turn this on to exclude walk-in till sales and see only online and phone orders |
## Printing
Click **Print** to get a print-optimised view of the full report, with a header showing the peak name and date range.
## How the data is calculated
Peak reporting uses **fulfilment dates**, not order dates. An order placed on February 10 for delivery on February 14 counts as a Valentine's Day order.
Cancelled orders are excluded from every peak calculation. By default, only paid and partially paid orders are included. You can toggle unpaid orders on if needed.
The "average day" baseline is calculated from the same year, excluding the peak period itself and applying the same filters you've selected.
## Common questions
The predefined peak view shows one year at a time, but you can switch between years to compare manually. The forecast chart shows three years side by side (previous, current, projected).
If no orders match the selected period and filters, you'll see a helpful message with a year selector so you can try a different year.
Peak reporting comes with Digital Florists, but a few instances still need it switched on. [Get in touch with support](/get-started/getting-help) to get it turned on.
The list of predefined peaks is fixed for now, but you can pick **Custom dates...** as the period to analyse any date range you like.
Because peak demand is about when flowers need to be ready and delivered, not when the order was placed. A Valentine's order placed in January still needs to be fulfilled on February 14.
## What's next?
Back to the analytics overview.
Drill into staff, product, and customer performance.
See where your orders are coming from by town, postcode, or county.
Download detailed reports for any area of your business.
 ## How it works
Pick a **period** to analyse and a **comparison** to measure it against. The period is either a predefined peak or a custom date range. The comparison is the previous year, the previous period, custom dates, or nothing.
### Predefined peaks
Select a peak period and a year, and your dashboard shows you everything that happened during that window: orders, revenue, products sold, customer behaviour, and more. It also compares each day against your average daily performance for the rest of the year, so you can see how much busier you were.
Covers the major UK and international floral peaks: Valentine's Day, International Women's Day, Mother's Day, International Mother's Day, Father's Day, Easter, Thanksgiving, and Christmas. Dates are calculated for you each year.
### Custom comparison
Pick **Custom dates...** as the period and set a date range. Then set **Compare against** to **Same dates last year** (the default), **Previous period**, **Custom dates**, or **No comparison**. Named peaks can be compared too, with the same options minus **Previous period** (since the 5 days before a named peak isn't a useful comparison).
This is useful for comparing:
* This December vs last December
* A promotional week vs a normal week
* Any two periods you want to measure against each other
## What you'll see
### Summary cards
At the top, you get the headline numbers for your selected period.
| Metric | What it shows |
| --------------------- | ------------------------------------------------------------------------------------------------- |
| **Total orders** | How many orders you fulfilled |
| **Total sales** | Your revenue for the period |
| **Average order** | How much each customer spent on average |
| **Average lead time** | How many days ahead customers placed their orders, alongside the percentage of last-minute orders |
| **Open tasks** | Tasks due during the period that haven't been completed yet |
### Volume impact
This shows how much busier each day of the peak was compared to a normal day. You'll see ratios like "2.5x busier than average", meaning you handled two and a half times your usual daily volume.
The average is calculated from the rest of the year, excluding the peak period itself, so peak days are compared against your typical day rather than against themselves.
### Charts and breakdowns
Peak reporting is split across four tabs. Each tab focuses on a different angle of the same peak window.
#### Overview
| Chart | What it shows |
| ------------------------- | ---------------------------------------------------------------------- |
| **Daily Sales & Orders** | Revenue and volume trends across each day of the peak |
| **Hourly Order Patterns** | When during the day customers are placing orders (useful for staffing) |
#### Customers & Sales
| Chart | What it shows |
| ---------------------------- | -------------------------------------------------------------- |
| **Fulfilment Methods** | How many went out for delivery vs were collected in-store |
| **Customer Types** | New customers vs returning customers |
| **Order Sources** | Where orders came from, based on the sources you've configured |
| **Revenue by Customer Type** | How much each customer group spent |
| **Order Value Distribution** | How your orders break down across price bands |
| **Last-Minute Orders** | The percentage placed within 24 hours of fulfilment |
| **Popular Delivery Times** | Which time slots customers requested most |
#### Products & Workload
| Chart | What it shows |
| ---------------------------- | ---------------------------------------------------------------- |
| **Best-Selling Products** | Your top products by quantity during the peak |
| **Revenue by Category** | Which product categories performed best |
| **Workload & Item Analysis** | How multi-item orders affect the real volume of stems to prepare |
#### Geography & Forecast
| Chart | What it shows |
| ----------------------------- | --------------------------------------------------------------- |
| **Geographical Distribution** | Top postcodes by order volume, revenue, and average order value |
| **Forecast** | A three-year projection for predefined peaks (see below) |
## How it works
Pick a **period** to analyse and a **comparison** to measure it against. The period is either a predefined peak or a custom date range. The comparison is the previous year, the previous period, custom dates, or nothing.
### Predefined peaks
Select a peak period and a year, and your dashboard shows you everything that happened during that window: orders, revenue, products sold, customer behaviour, and more. It also compares each day against your average daily performance for the rest of the year, so you can see how much busier you were.
Covers the major UK and international floral peaks: Valentine's Day, International Women's Day, Mother's Day, International Mother's Day, Father's Day, Easter, Thanksgiving, and Christmas. Dates are calculated for you each year.
### Custom comparison
Pick **Custom dates...** as the period and set a date range. Then set **Compare against** to **Same dates last year** (the default), **Previous period**, **Custom dates**, or **No comparison**. Named peaks can be compared too, with the same options minus **Previous period** (since the 5 days before a named peak isn't a useful comparison).
This is useful for comparing:
* This December vs last December
* A promotional week vs a normal week
* Any two periods you want to measure against each other
## What you'll see
### Summary cards
At the top, you get the headline numbers for your selected period.
| Metric | What it shows |
| --------------------- | ------------------------------------------------------------------------------------------------- |
| **Total orders** | How many orders you fulfilled |
| **Total sales** | Your revenue for the period |
| **Average order** | How much each customer spent on average |
| **Average lead time** | How many days ahead customers placed their orders, alongside the percentage of last-minute orders |
| **Open tasks** | Tasks due during the period that haven't been completed yet |
### Volume impact
This shows how much busier each day of the peak was compared to a normal day. You'll see ratios like "2.5x busier than average", meaning you handled two and a half times your usual daily volume.
The average is calculated from the rest of the year, excluding the peak period itself, so peak days are compared against your typical day rather than against themselves.
### Charts and breakdowns
Peak reporting is split across four tabs. Each tab focuses on a different angle of the same peak window.
#### Overview
| Chart | What it shows |
| ------------------------- | ---------------------------------------------------------------------- |
| **Daily Sales & Orders** | Revenue and volume trends across each day of the peak |
| **Hourly Order Patterns** | When during the day customers are placing orders (useful for staffing) |
#### Customers & Sales
| Chart | What it shows |
| ---------------------------- | -------------------------------------------------------------- |
| **Fulfilment Methods** | How many went out for delivery vs were collected in-store |
| **Customer Types** | New customers vs returning customers |
| **Order Sources** | Where orders came from, based on the sources you've configured |
| **Revenue by Customer Type** | How much each customer group spent |
| **Order Value Distribution** | How your orders break down across price bands |
| **Last-Minute Orders** | The percentage placed within 24 hours of fulfilment |
| **Popular Delivery Times** | Which time slots customers requested most |
#### Products & Workload
| Chart | What it shows |
| ---------------------------- | ---------------------------------------------------------------- |
| **Best-Selling Products** | Your top products by quantity during the peak |
| **Revenue by Category** | Which product categories performed best |
| **Workload & Item Analysis** | How multi-item orders affect the real volume of stems to prepare |
#### Geography & Forecast
| Chart | What it shows |
| ----------------------------- | --------------------------------------------------------------- |
| **Geographical Distribution** | Top postcodes by order volume, revenue, and average order value |
| **Forecast** | A three-year projection for predefined peaks (see below) |
 ## Forecasting
For predefined peaks, Digital Florists shows a **forecast** for the next year based on your year-on-year growth. You'll see three bars side by side.
| Bar | What it shows |
| ----------------- | -------------------------------------------- |
| **Previous year** | What you did last time |
| **Current year** | What you did this time |
| **Forecast** | What Digital Florists projects for next year |
The forecast compares this year against last year, dampens the growth rate, and caps the maximum projected growth so a single big year doesn't skew the next one. If you don't have data for the previous year, the growth rate falls back to zero and the forecast matches this year.
This helps you plan how many stems to order, how many drivers to schedule, and how much stock to carry.
## Forecasting
For predefined peaks, Digital Florists shows a **forecast** for the next year based on your year-on-year growth. You'll see three bars side by side.
| Bar | What it shows |
| ----------------- | -------------------------------------------- |
| **Previous year** | What you did last time |
| **Current year** | What you did this time |
| **Forecast** | What Digital Florists projects for next year |
The forecast compares this year against last year, dampens the growth rate, and caps the maximum projected growth so a single big year doesn't skew the next one. If you don't have data for the previous year, the growth rate falls back to zero and the forecast matches this year.
This helps you plan how many stems to order, how many drivers to schedule, and how much stock to carry.