Viewing past runs
Go to Delivery and select a past date, or click History to see a list of all completed runs.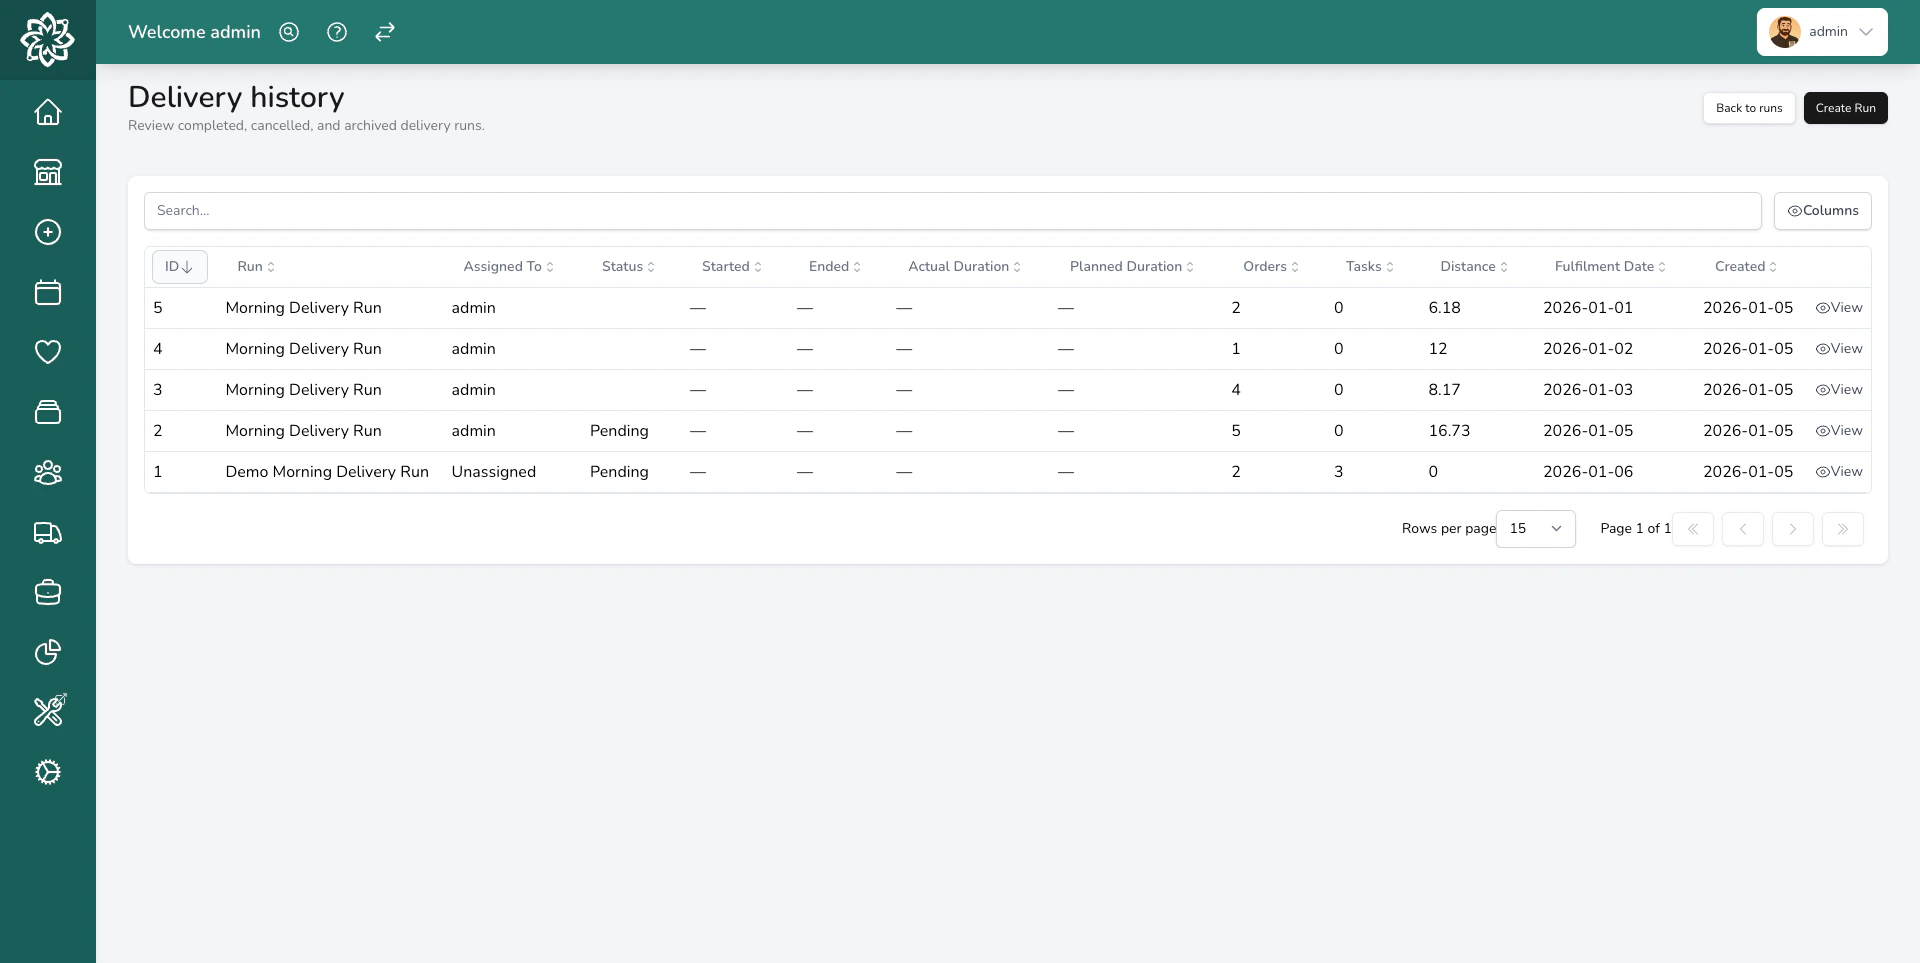
Viewing past delivery runs
- The date and driver
- Number of stops — total, delivered, carded, and returned
- Total distance and drive time
- The completion time — when the last stop was dealt with
Run performance
For every completed run you can see how long it took versus how long it was expected to take. The expected duration is built from the route distance and a per-stop allowance (5 minutes for an order; the configured duration for a task). Comparing planned vs actual helps you spot runs that are routinely overloaded or under-resourced. For trends across drivers, date ranges, or locations, use the Delivery section of Insights — that’s where the full analytics live.Punctuality
Punctuality Monitoring is an optional feature that tracks whether each stop arrived within its planned time window. It’s off by default — turn it on in Settings > General > Delivery.You can adjust the two thresholds Digital Florists uses to flag a stop. Late defaults to 15 minutes past the planned time; Very Late defaults to 30 minutes. The defaults work for most shops — tighten them for a busy city centre, loosen them for a rural area covering longer distances.
Stop ratings
When a run is marked complete, each stop is rated:The run score
Each run gets a percentage — on-time stops divided by scored stops (Skipped stops are excluded; No Data stops count). The score is colour-coded:- Green (80% and above) — most deliveries arrived on time
- Amber (50–79%) — room for improvement
- Red (below 50%) — a significant number of deliveries were late
- Stop Details — a table of every stop with planned time, actual time, deviation, and a colour-coded badge.
- Route Map — the driver’s GPS trail with colour-coded pins at each stop (green, amber, red, grey). Useful for spotting patterns — for example, late deliveries clustered in one area might mean a recurring traffic or access problem.
Driver punctuality
Across multiple runs, the Driver Punctuality view in Insights compares each driver’s average score, on-time percentage, and run count for the selected date range. Useful for spotting who might need support, a route adjustment, or fewer stops per run.Using history to improve
A few practical ways to get value from delivery history:Spot problem addresses
If the same address keeps coming up as carded or returned, there might be an access issue (gated community, no doorbell, business that closes early). Add a note to the customer’s record so drivers know what to expect next time.Right-size your runs
If runs are consistently taking longer than expected, you might be adding too many stops. Most shops find 8–12 stops is a good balance between efficiency and punctuality. Two runs of 8 stops are usually more punctual than one run of 16.Plan staffing
If certain days of the week are consistently busier (e.g., Fridays and Saturdays), you can plan to have an extra driver available.Check driver performance
If one driver consistently has lower punctuality or more returned deliveries than others, it might be a training opportunity — or they might just be getting the trickiest runs. Use the data to have a fair conversation.Tighten unrealistic time windows
If timed slots like “between 10am and 11am” keep coming up as Late, the route may not physically be able to reach them in time. Review your delivery slots to make sure the windows are achievable.Common questions
How far back does delivery history go?
How far back does delivery history go?
Your delivery history is kept for as long as your account is active. You can view runs from any date.
Can I export delivery data?
Can I export delivery data?
Yes. Delivery data is included in the exports section. You can export delivery run details, punctuality data, and driver performance to a spreadsheet.
Can I see proof-of-delivery photos from old runs?
Can I see proof-of-delivery photos from old runs?
Yes. Photos are kept on the order. Click into any past run, then click a stop to see its delivery photo. The customer’s tracking page keeps the photo viewable for a week after delivery.
What happens to old runs if I enable Punctuality Monitoring later?
What happens to old runs if I enable Punctuality Monitoring later?
Only runs completed after you turn it on are scored. Past runs aren’t retroactively analysed.
Does Punctuality Monitoring affect anything else?
Does Punctuality Monitoring affect anything else?
No. It’s purely informational — it records and displays data but doesn’t change how orders, delivery runs, or notifications work. Customers don’t see scores.
What’s next?
Delivery Runs
Create and manage your delivery runs.
Tracking & Proof of Delivery
Track your drivers and share live updates with customers.
Insights
Delivery trends, driver punctuality, and performance over time.
Delivery Slots
Configure your delivery windows and same-day settings.