This page covers features gated by Manager-tier permissions. Managers and Admins have these by default; your administrator can adjust who has them in Settings > Team.
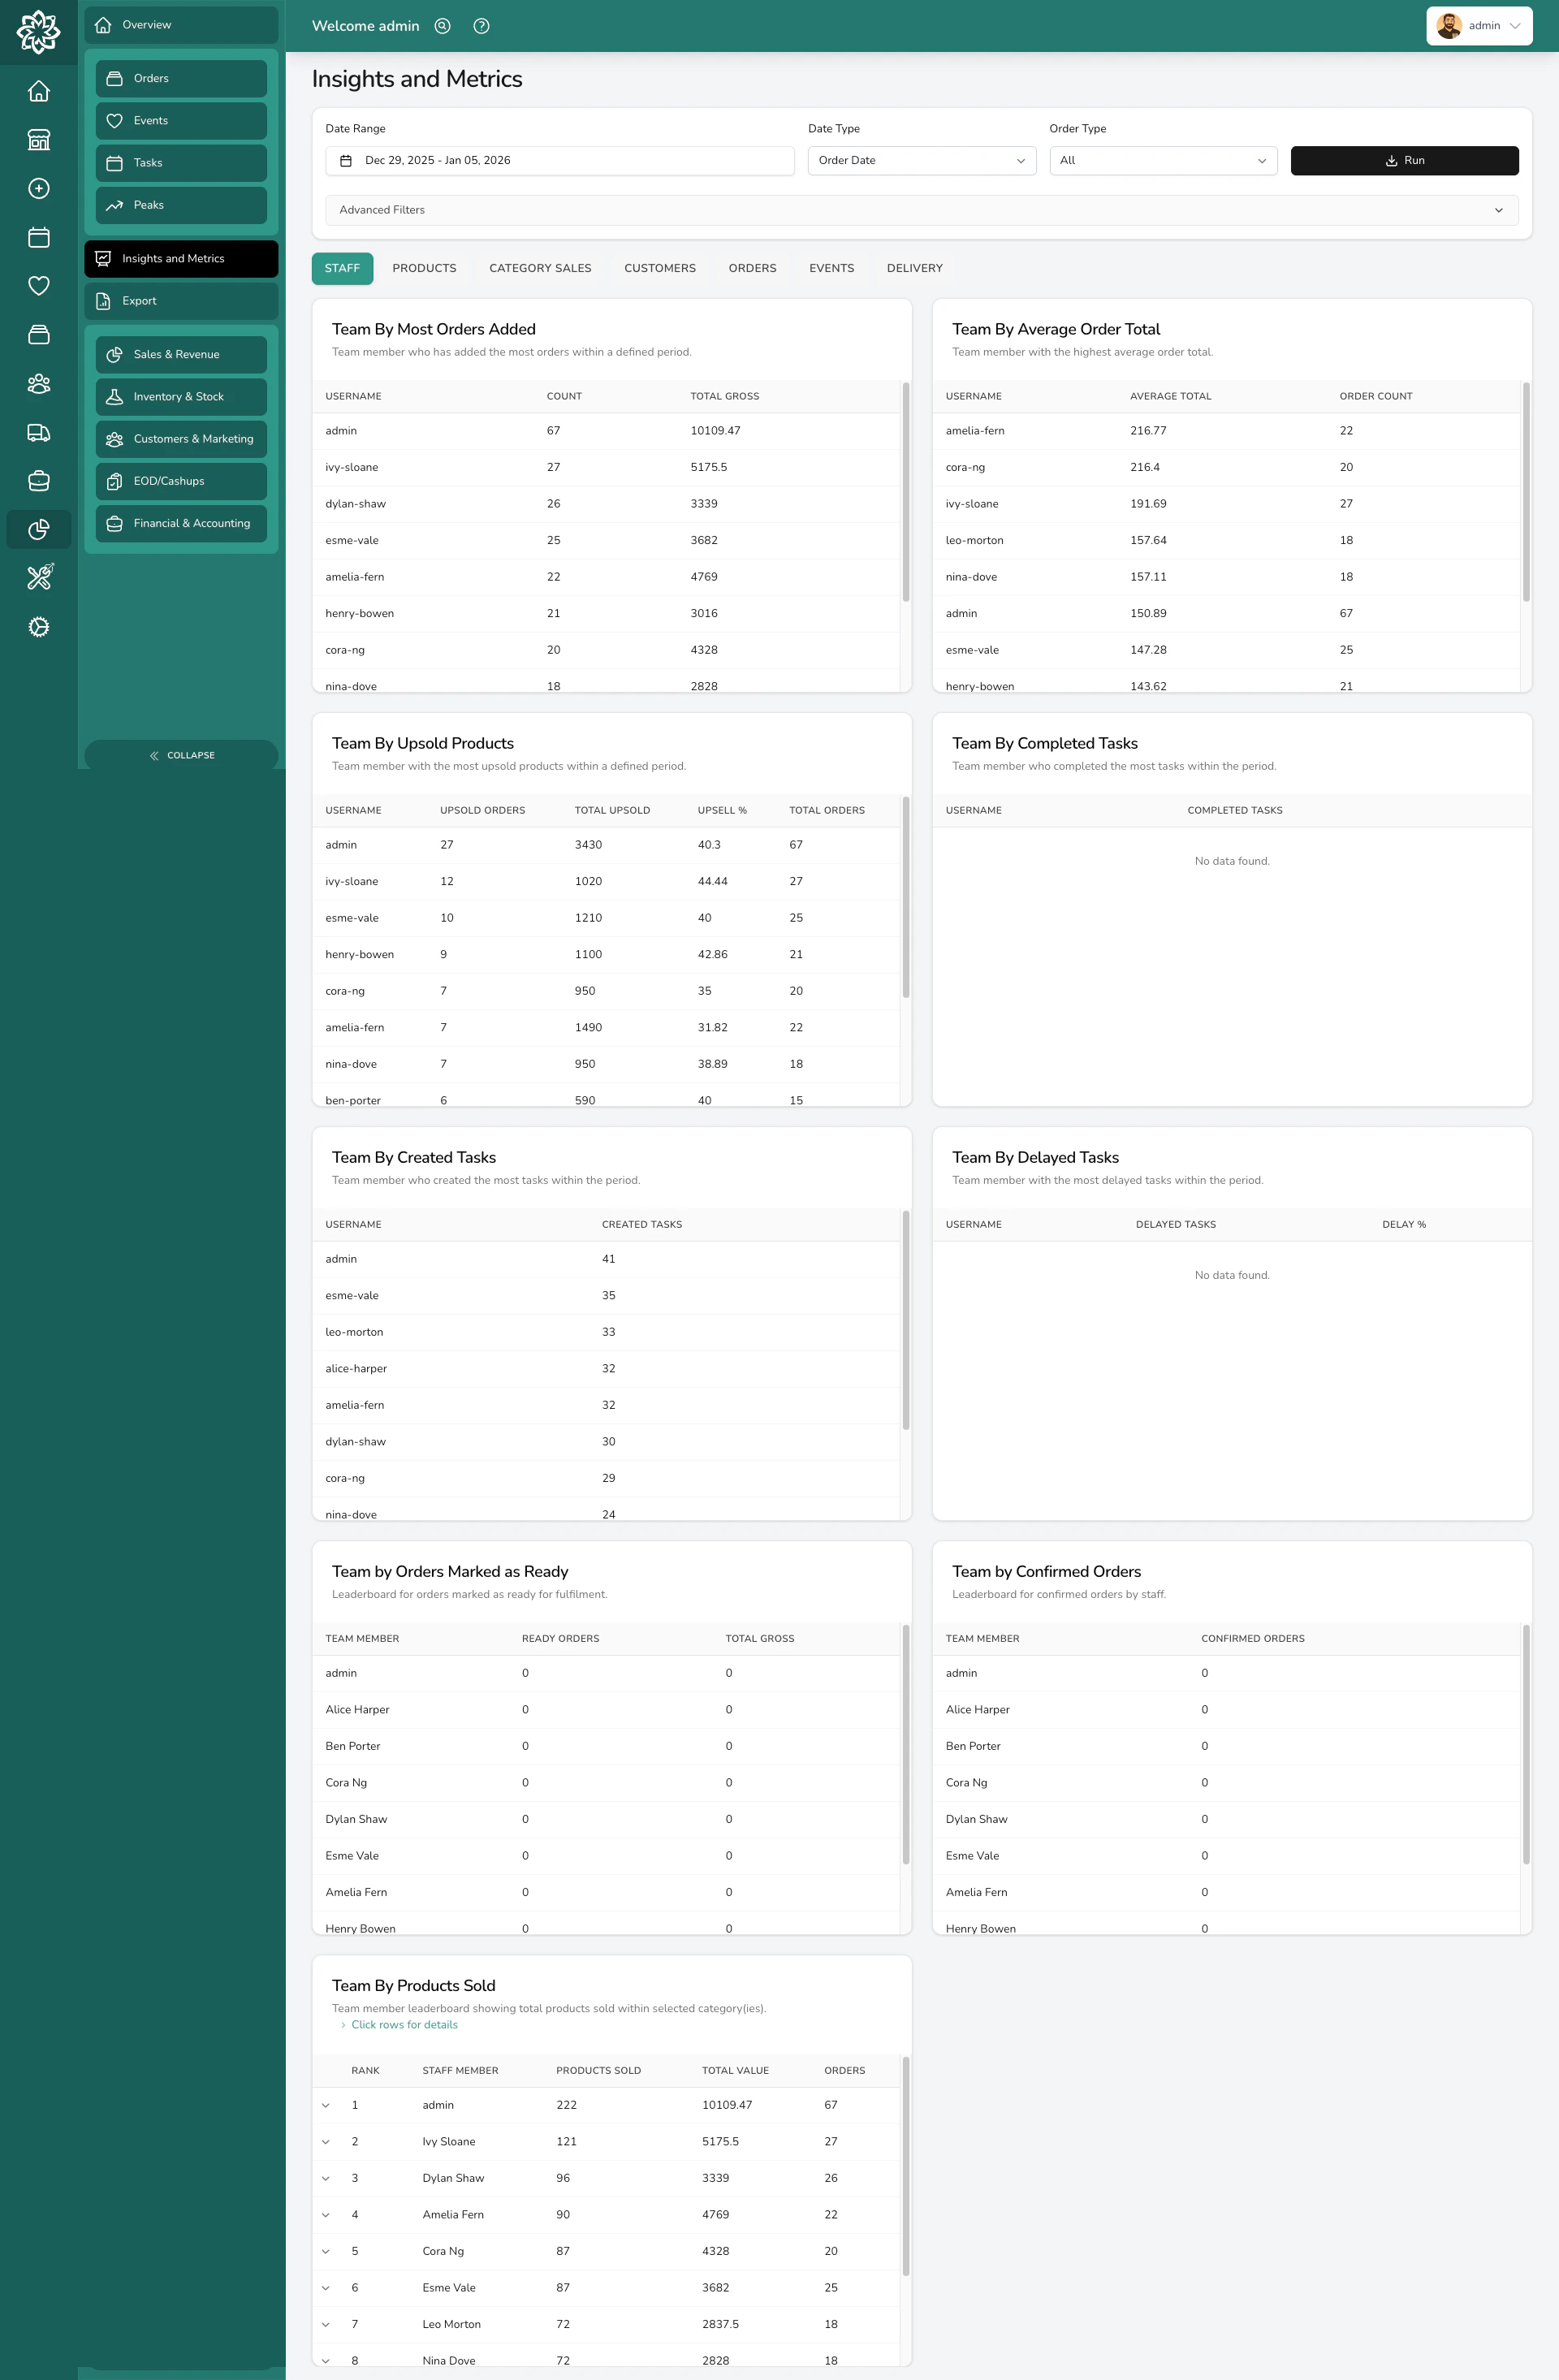
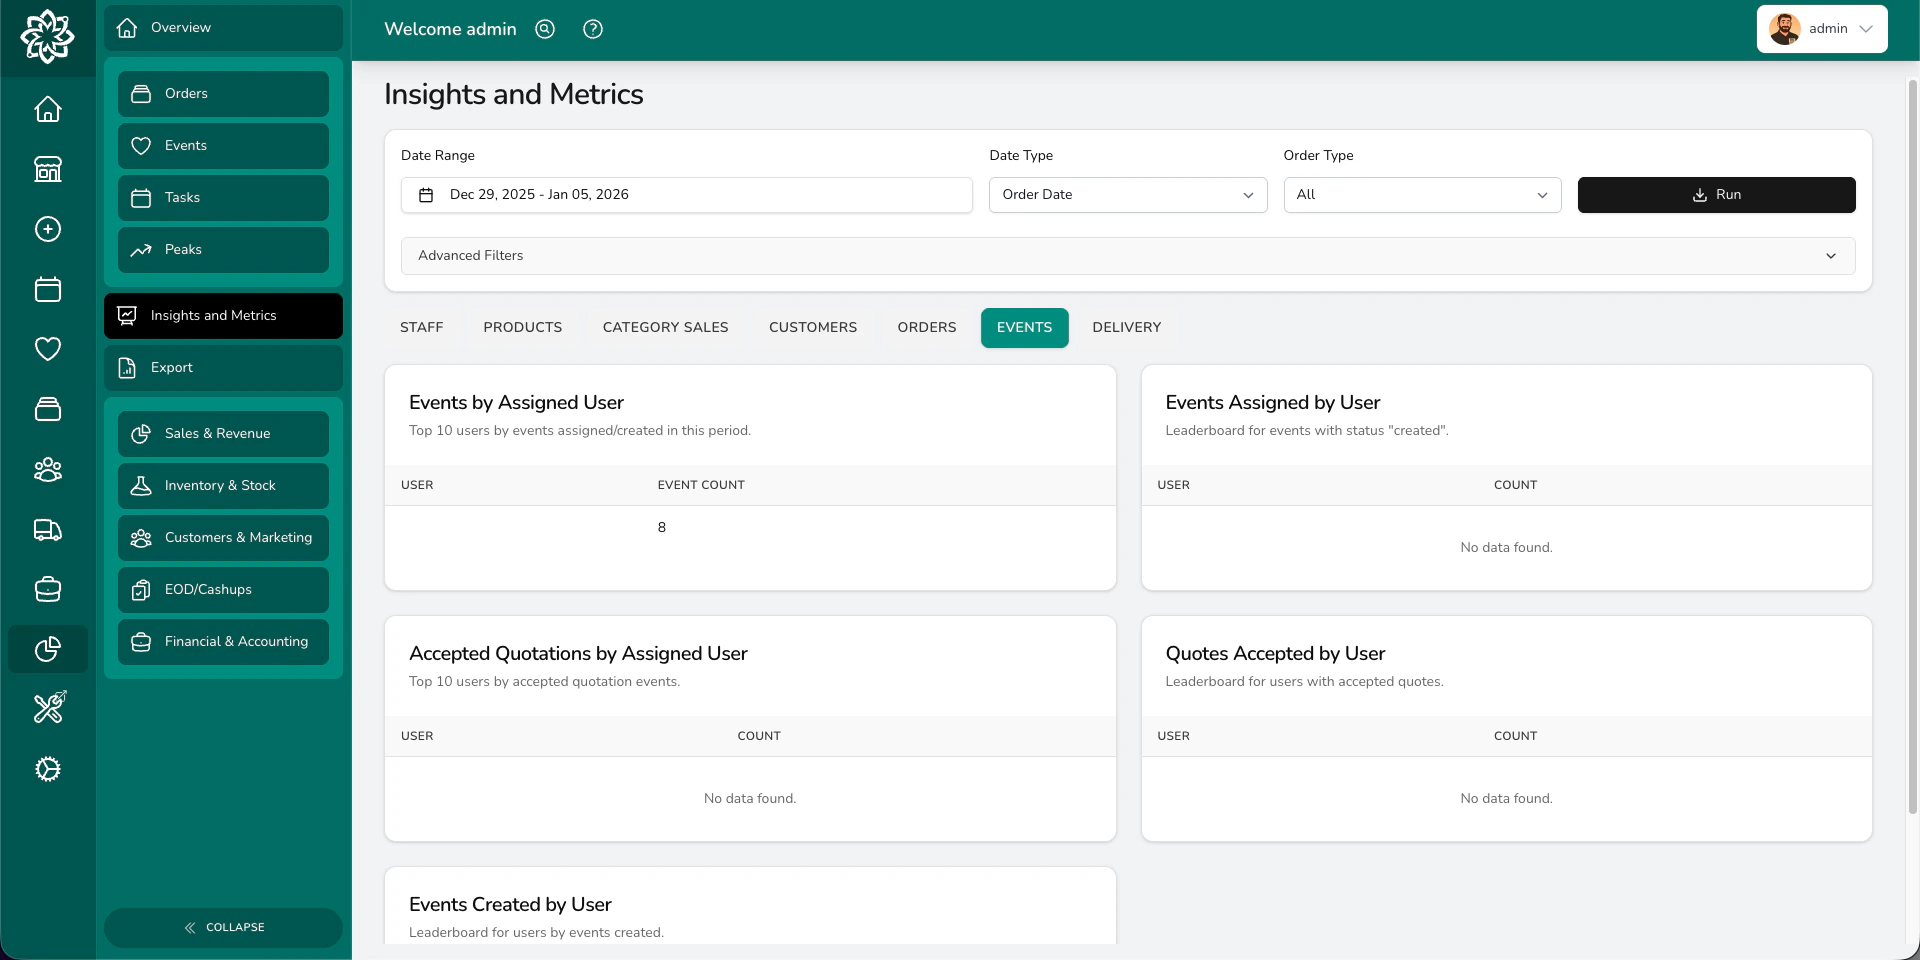
Insights overview with category tabs
How it works
Set your date range and filters, press Run, and the page loads a series of analytics blocks — tables and charts grouped under tabs. Each tab focuses on one part of the business. Some blocks have a small download button in their header for that block’s data. For full data downloads across the shop, head to Reports.Tabs
Staff
How your team is performing:- Team By Most Orders Added — who’s added the most orders, with total gross
- Team By Average Order Total — who’s writing the highest-value orders on average
- Team By Upsold Products — who’s adding upsell items (defined by your upsell category)
- Team By Completed Tasks — who’s closed the most tasks in the period
- Team By Created Tasks — who’s creating tasks
- Team By Delayed Tasks — tasks whose due date moved, with a delay percentage
- Team by Confirmed Orders — who’s confirmed the most orders
- Team By Products Sold — products sold by each team member, with a per-product breakdown
- Team By Orders Marked Ready — who’s marking orders ready for fulfilment
Products
What’s selling and how it’s bundled:- Most Ordered Products — top 10 by order count, with total gross
- Products Sold by Designer — sales grouped by the designer named on each product
- Frequently Bought Together — product pairs that appear in the same order most often
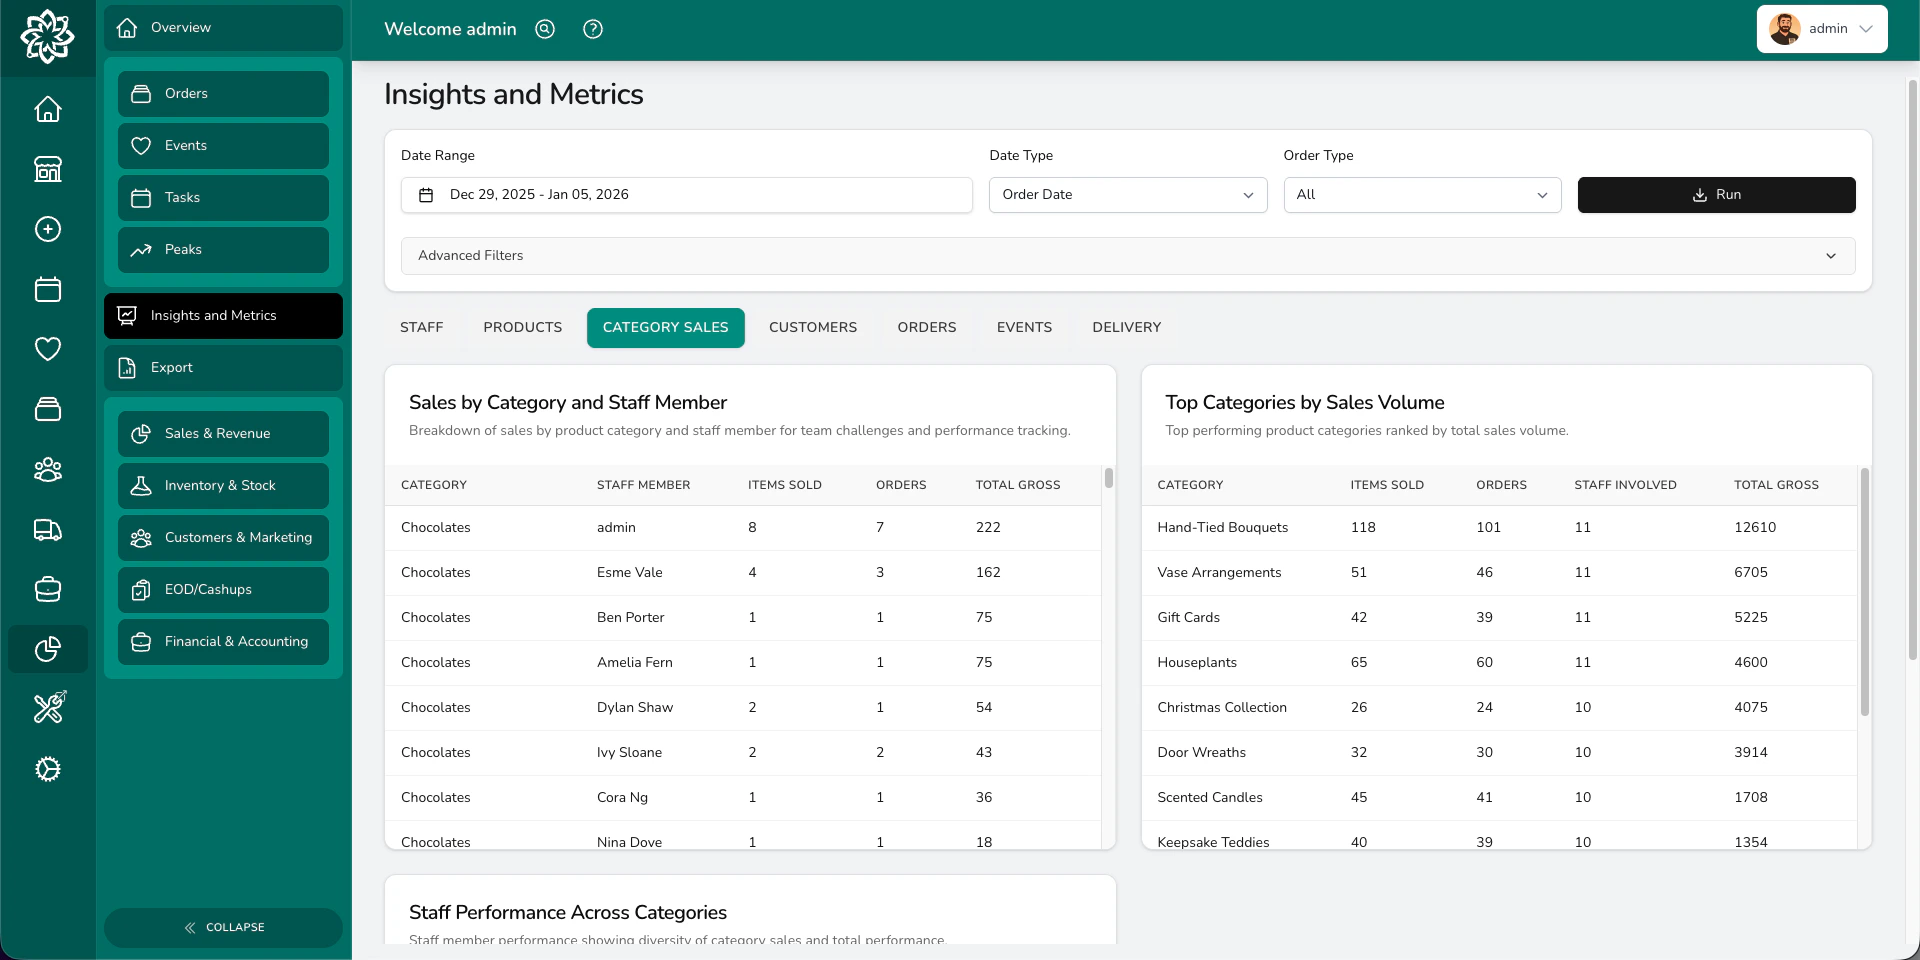
Product category breakdown
Category sales
Sales broken down by product category:- Sales by Category and Staff Member — items, orders, and gross per category per staff member
- Top Categories by Sales Volume — top 15 categories by gross
- Staff Performance Across Categories — how many categories each team member sold from
Customers
Three leaderboards covering who’s buying:- Customers by Orders — top 10 by order count, with total spent
- Customers by Total Spent — top 10 by spend across the period
- Credit Customers by Total Spent — top 10 account customers by spend
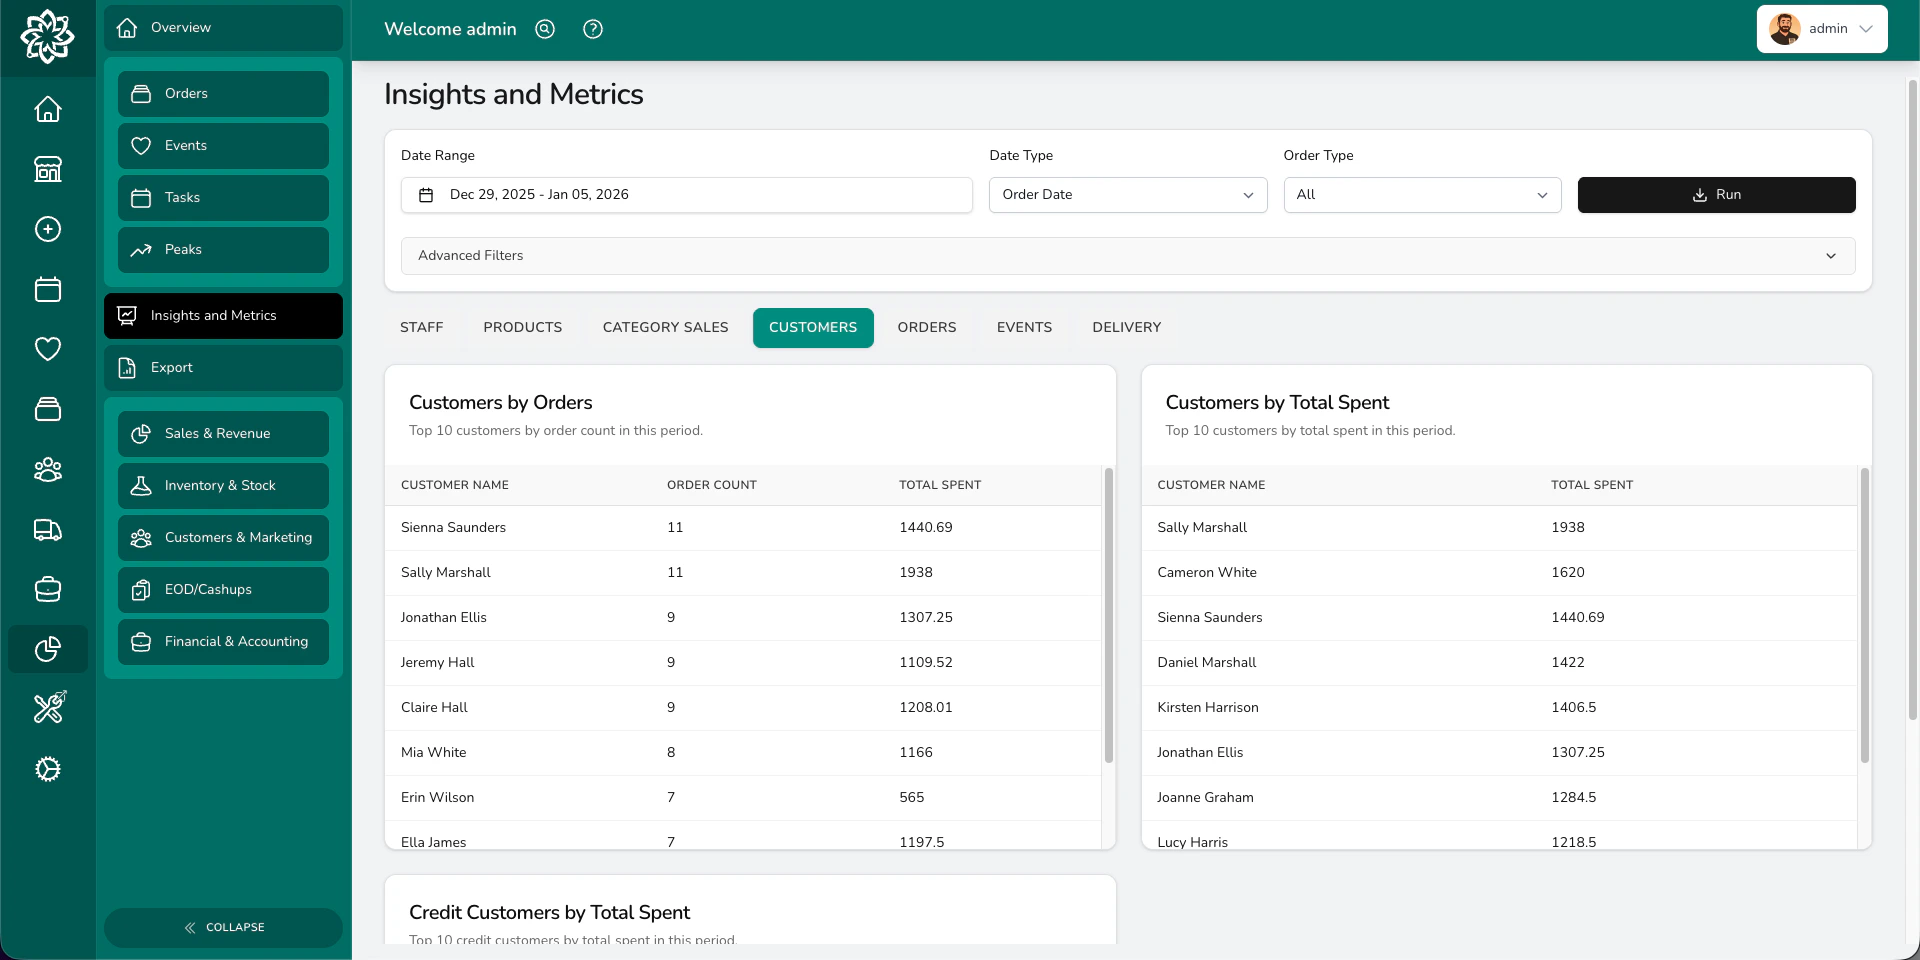
Customer insights
Orders
A wide breakdown of order data:- Counts grouped by status, order source, payment status, fulfilment method, order type, occasion, payment method, fulfilment date, delivery slot, and integration
- Delivery Orders by Postcode Area (UK shops only)
- Order Processing Time by Stage — average time between status changes
- Sales by Occasion with year-on-year comparison
- Occasion Sales by Month — monthly trend for the top occasions
- Payment Aging Analysis — outstanding orders grouped by age bucket
- Orders Marked Ready charts — daily trend, by hour, by source, and top 10 staff comparison
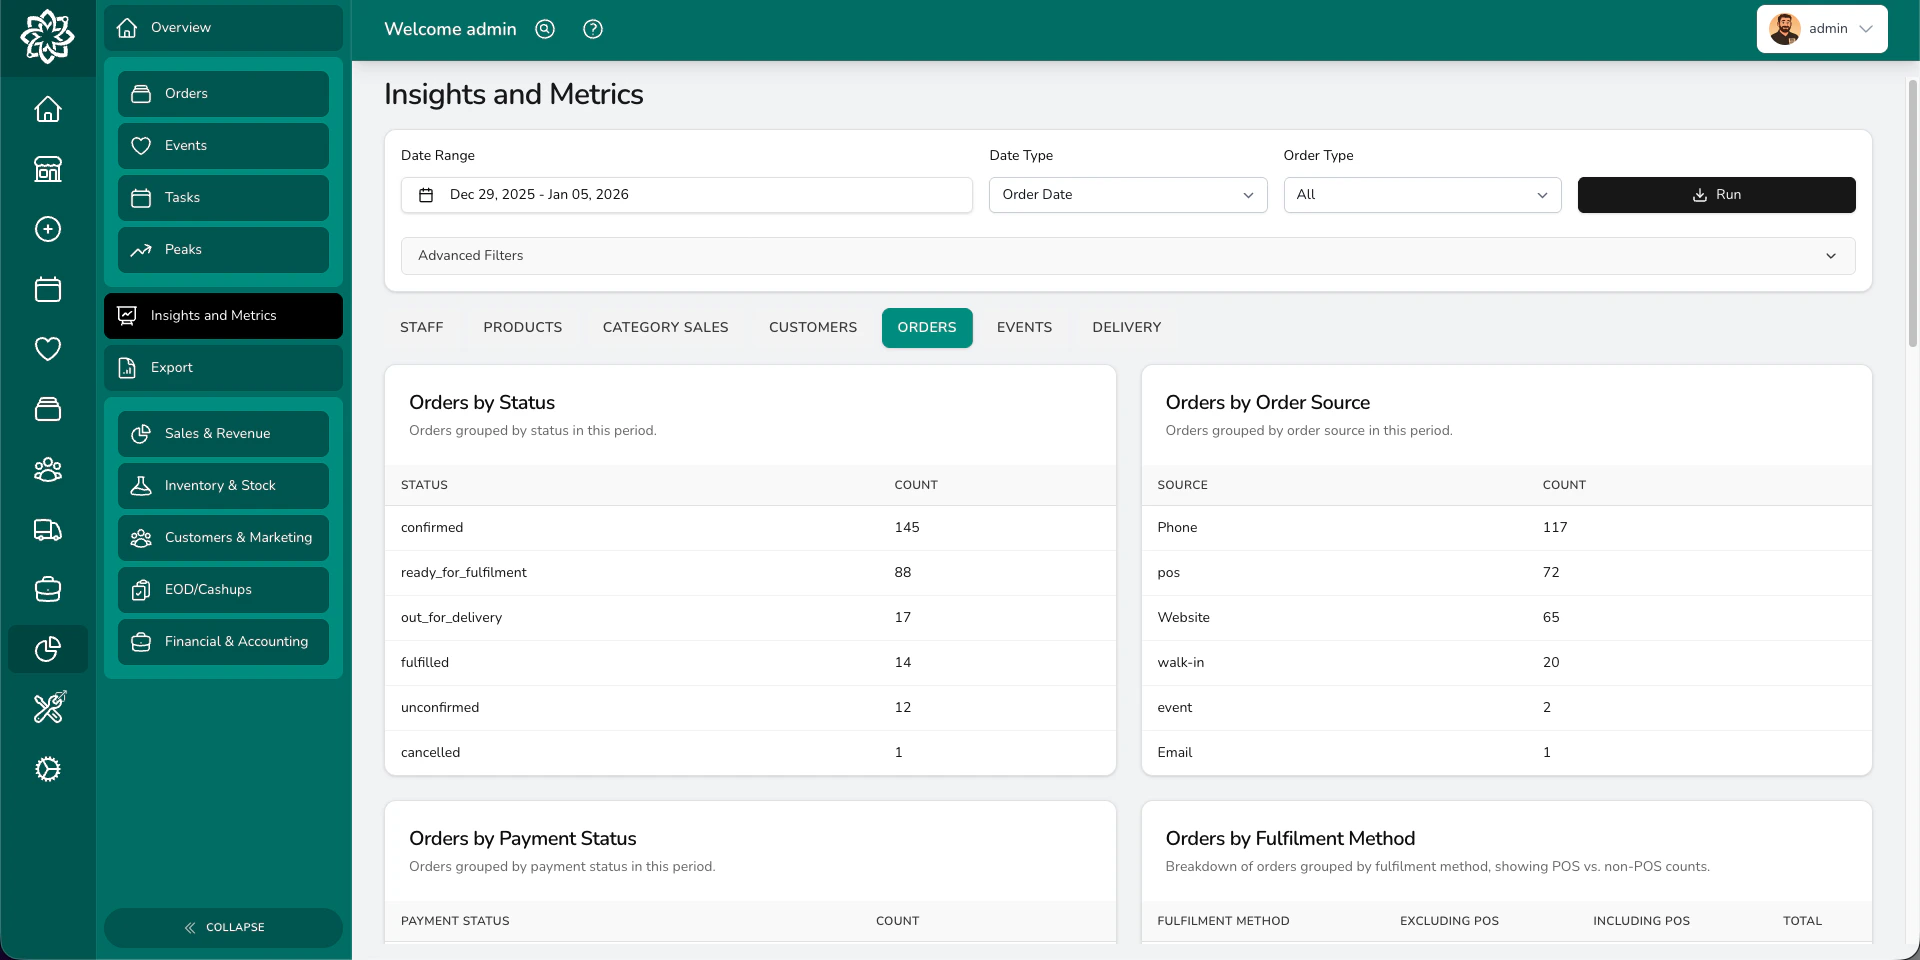
Order insights
Events
Your wedding and event pipeline:- Leaderboards for events created, events assigned, and quotes accepted by user
- Events by Venue — useful for spotting where to exhibit at wedding fairs
- Events by Marketing Source — where leads come from
- Events by Type — which event categories you run most
- Event Quote Conversion Funnel — how events move from draft to completed, with average days in each stage
- Quote Conversion Rate Over Time — monthly conversion trend
Event insights
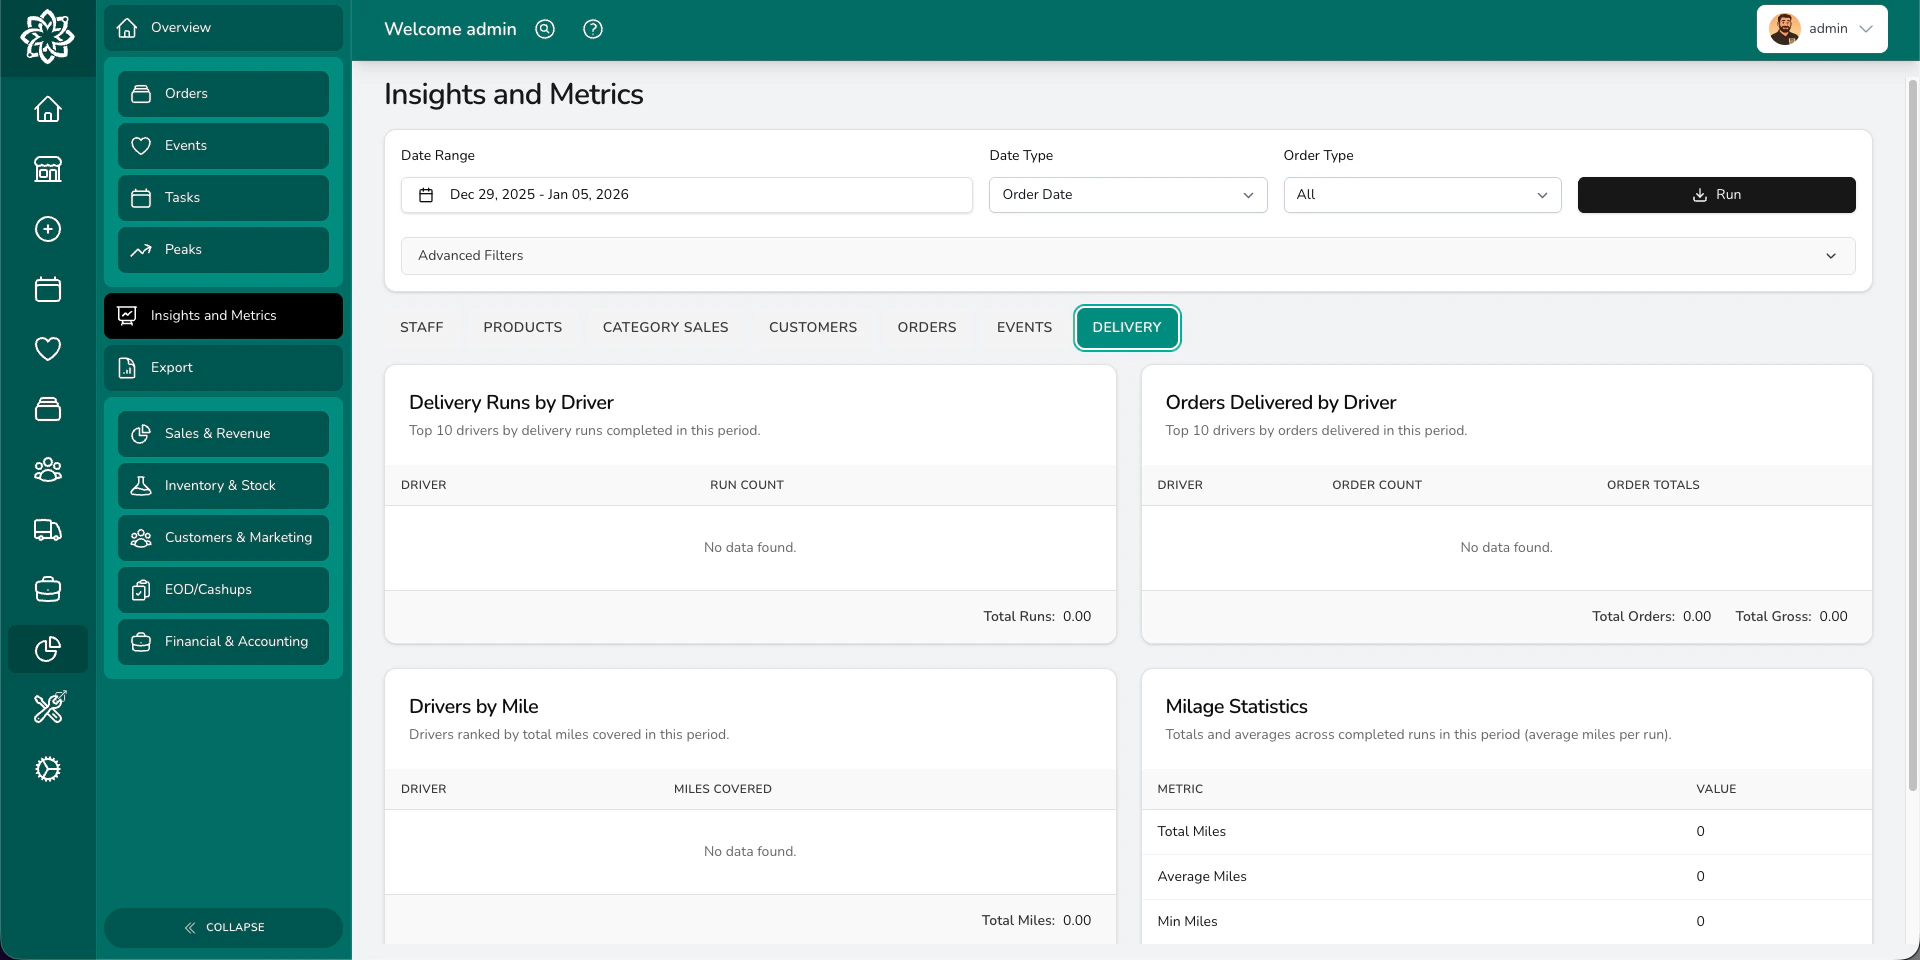
Delivery
How your runs and drivers are performing:- Delivery Runs by Driver — top 10 drivers by completed runs
- Orders Delivered by Driver — orders and gross delivered per driver
- Drivers by Mile — total miles per driver
- Milage Statistics — totals, averages, fees, and average deliveries per run
- Driver Performance Summary — runs, stops, average duration, and time per stop
- Daily Delivery Completions — runs completed per day
- Driver Punctuality — average score, on-time, late, and very late percentages per driver
Delivery analytics only include data from October 2025 onwards. Earlier runs from the legacy driver system aren’t included.
Delivery performance insights
Filtering
Set the filters at the top of the page before pressing Run.- Date Range — pick a preset (Today, Last 7 days, Last 30 days, This month, Last month, This year, Last year) or choose custom dates
- Date Type — Order Date or Fulfilment Date
- Order Type — All, Gift, Funeral, Corporate, or Event
- Product Categories — pick one or more, with an option to include subcategories
- Locations — pick one shop or several
- Integrations — limit to specific connected integrations
- Order Sources — limit to specific order sources, or include orders with no source
Common questions
Can I export insights data?
Can I export insights data?
A few blocks have a small download button in their header — Team By Orders Marked Ready, Customers by Orders, Customers by Total Spent, and Driver Punctuality. For full data downloads, see Reports.
Why do some blocks not show anything?
Why do some blocks not show anything?
If a block has no data for your filters and date range, it stays empty. Try widening the date range or removing filters.
What's the difference between insights and reports?
What's the difference between insights and reports?
Insights are on-screen tables and charts. Reports are downloadable spreadsheets you can open in Excel or Google Sheets.
Why is Driver Punctuality missing?
Why is Driver Punctuality missing?
The Driver Punctuality block only appears if Punctuality Monitoring is turned on. See Delivery History for how to enable it.
What’s next?
Analytics
See the high-level overview of your shop’s performance.
Peak Reporting
Compare your busiest periods year-on-year.
Reports
Download detailed reports as spreadsheets.
Delivery History
Review past runs, punctuality, and driver performance.