How it works
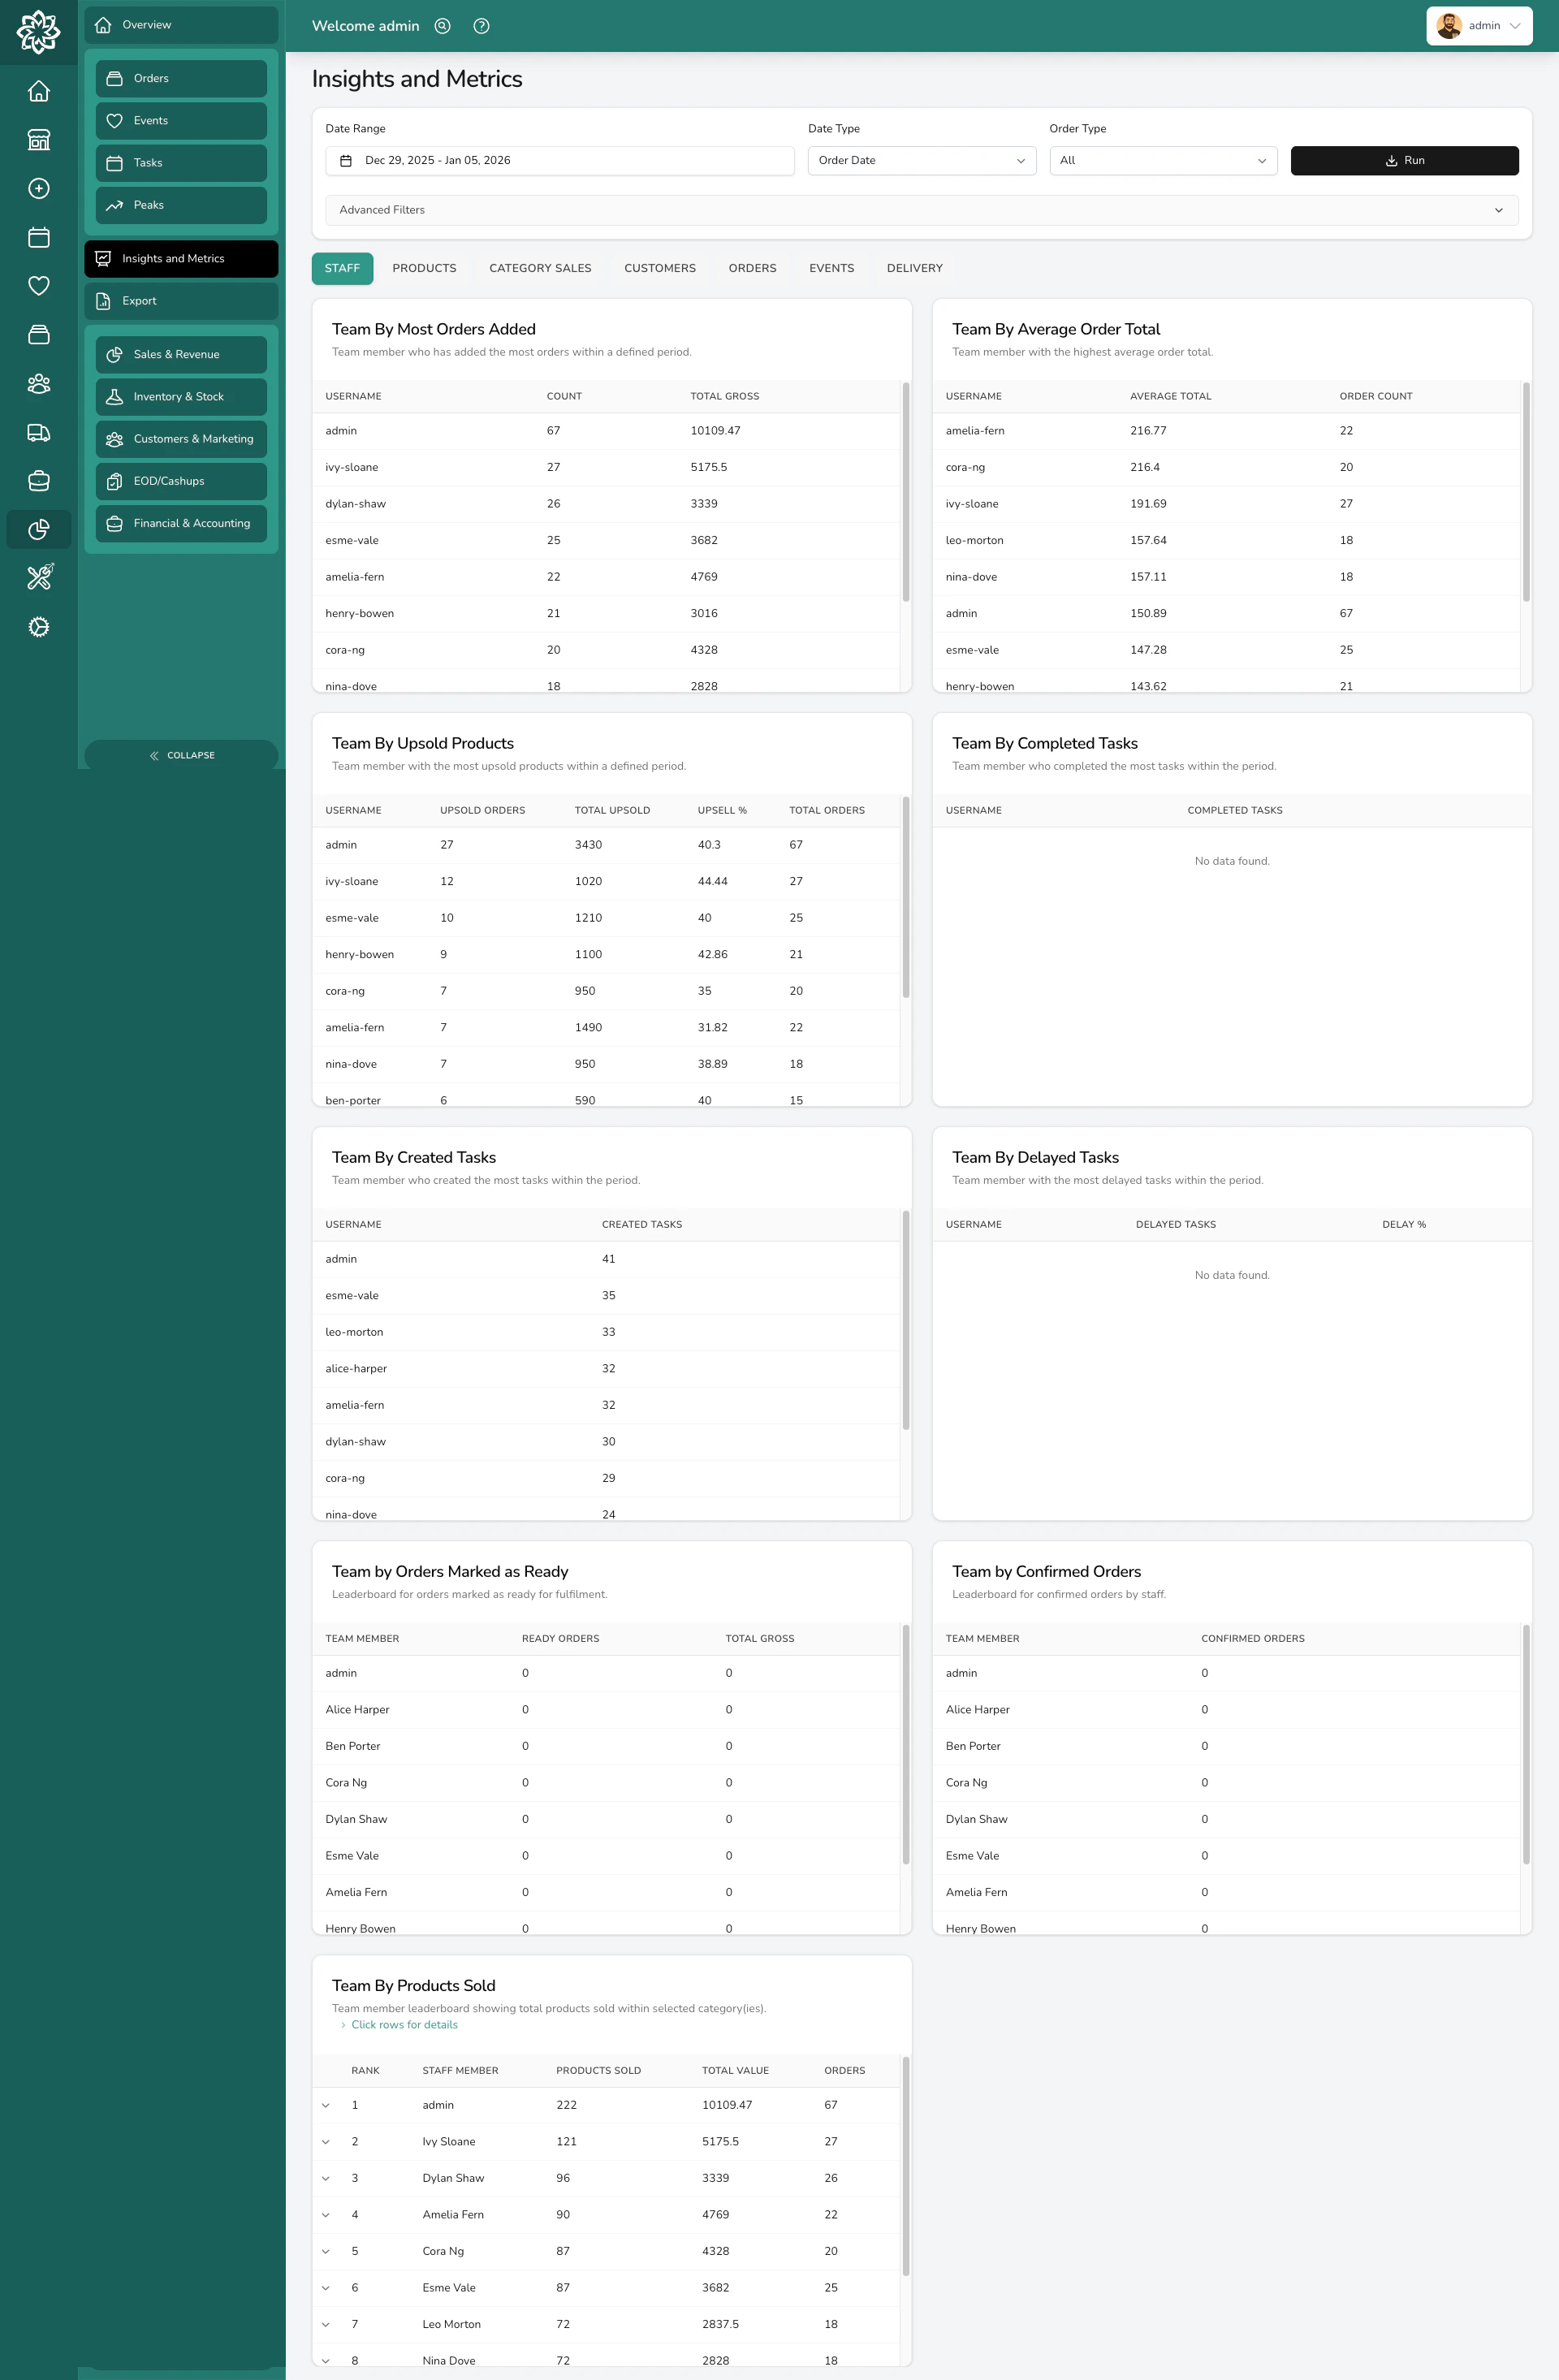
Insights shows you a series of analytics blocks — charts and tables that update based on your filters. Each block answers a specific business question. Pick a category to focus on, set your date range and filters, and the page loads the relevant blocks. You can scroll through them all or focus on the ones that matter most.Categories
Staff
See how your team is performing:- Team revenue — who’s bringing in the most sales
- Products sold by team member — who’s selling the most items
- Orders marked ready — who’s completing the most orders
- Upsell tracking — who’s adding extras and upgrades to orders
Products
Understand what’s selling and what isn’t:- Top products by revenue — your highest-earning products
- Top products by quantity — your most popular products by volume
- Product affinity — which products are frequently ordered together
- Product performance rankings — overall product league table
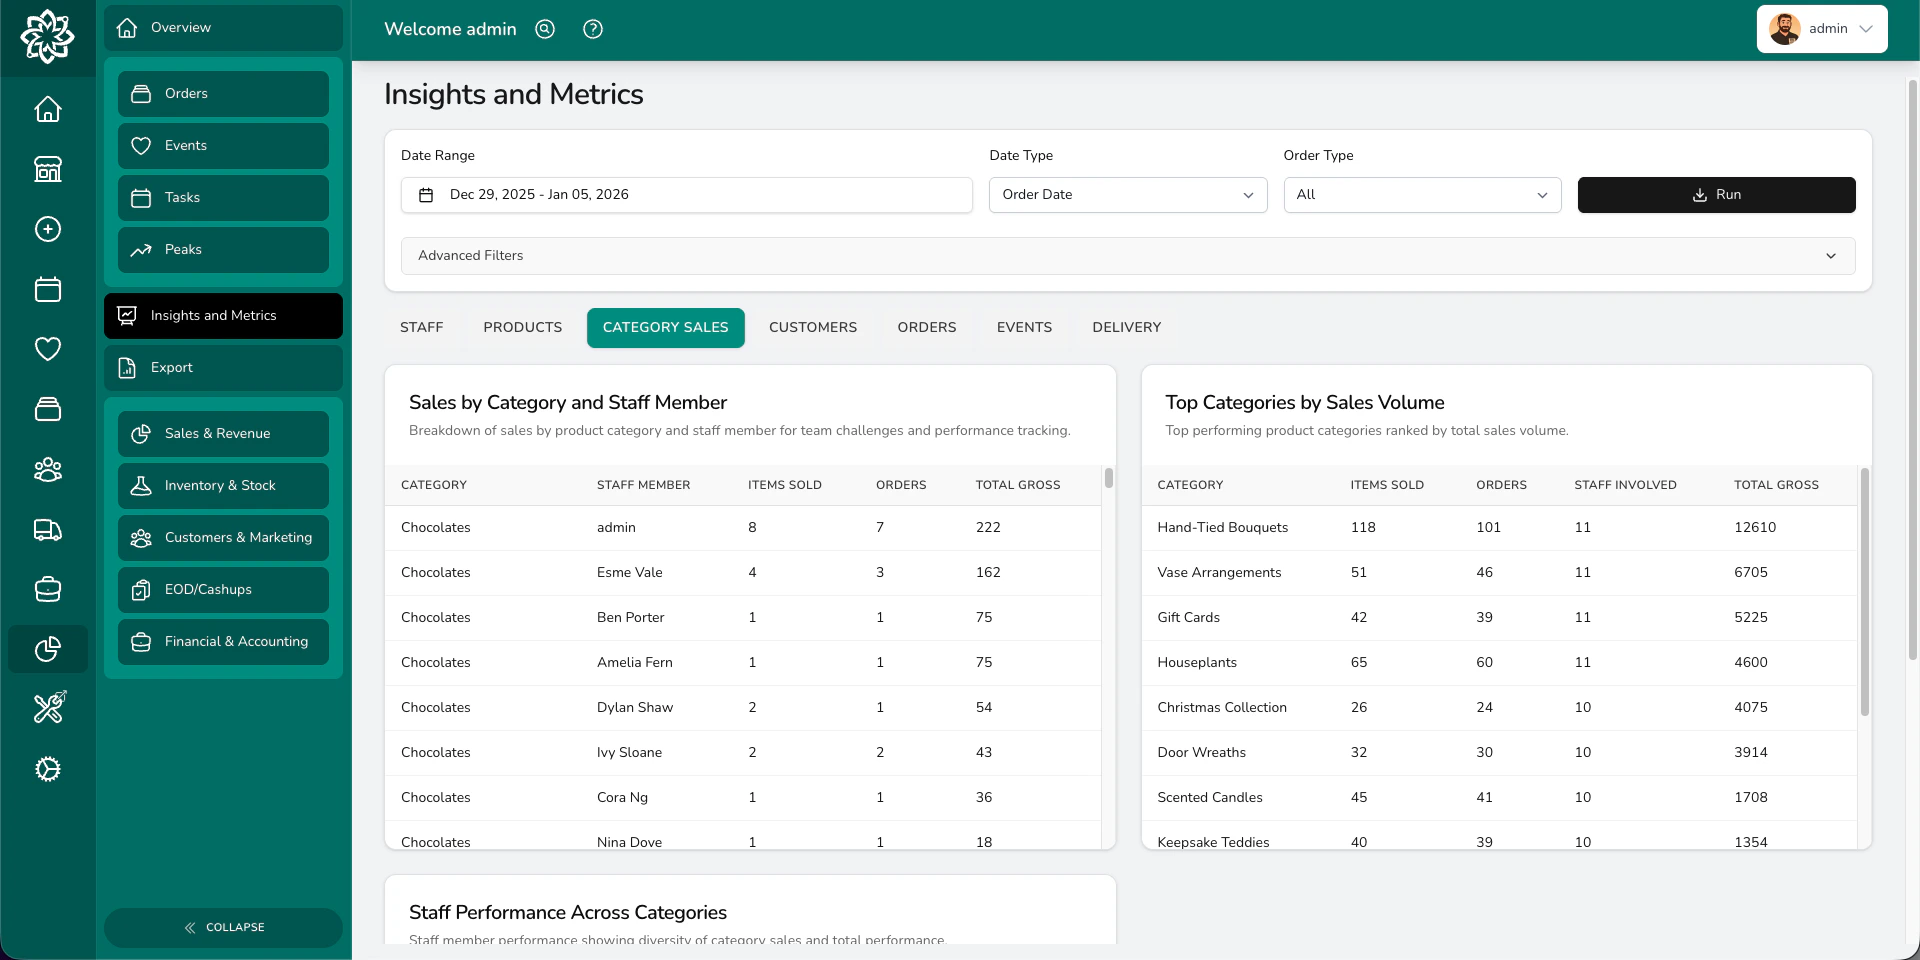
Category Sales
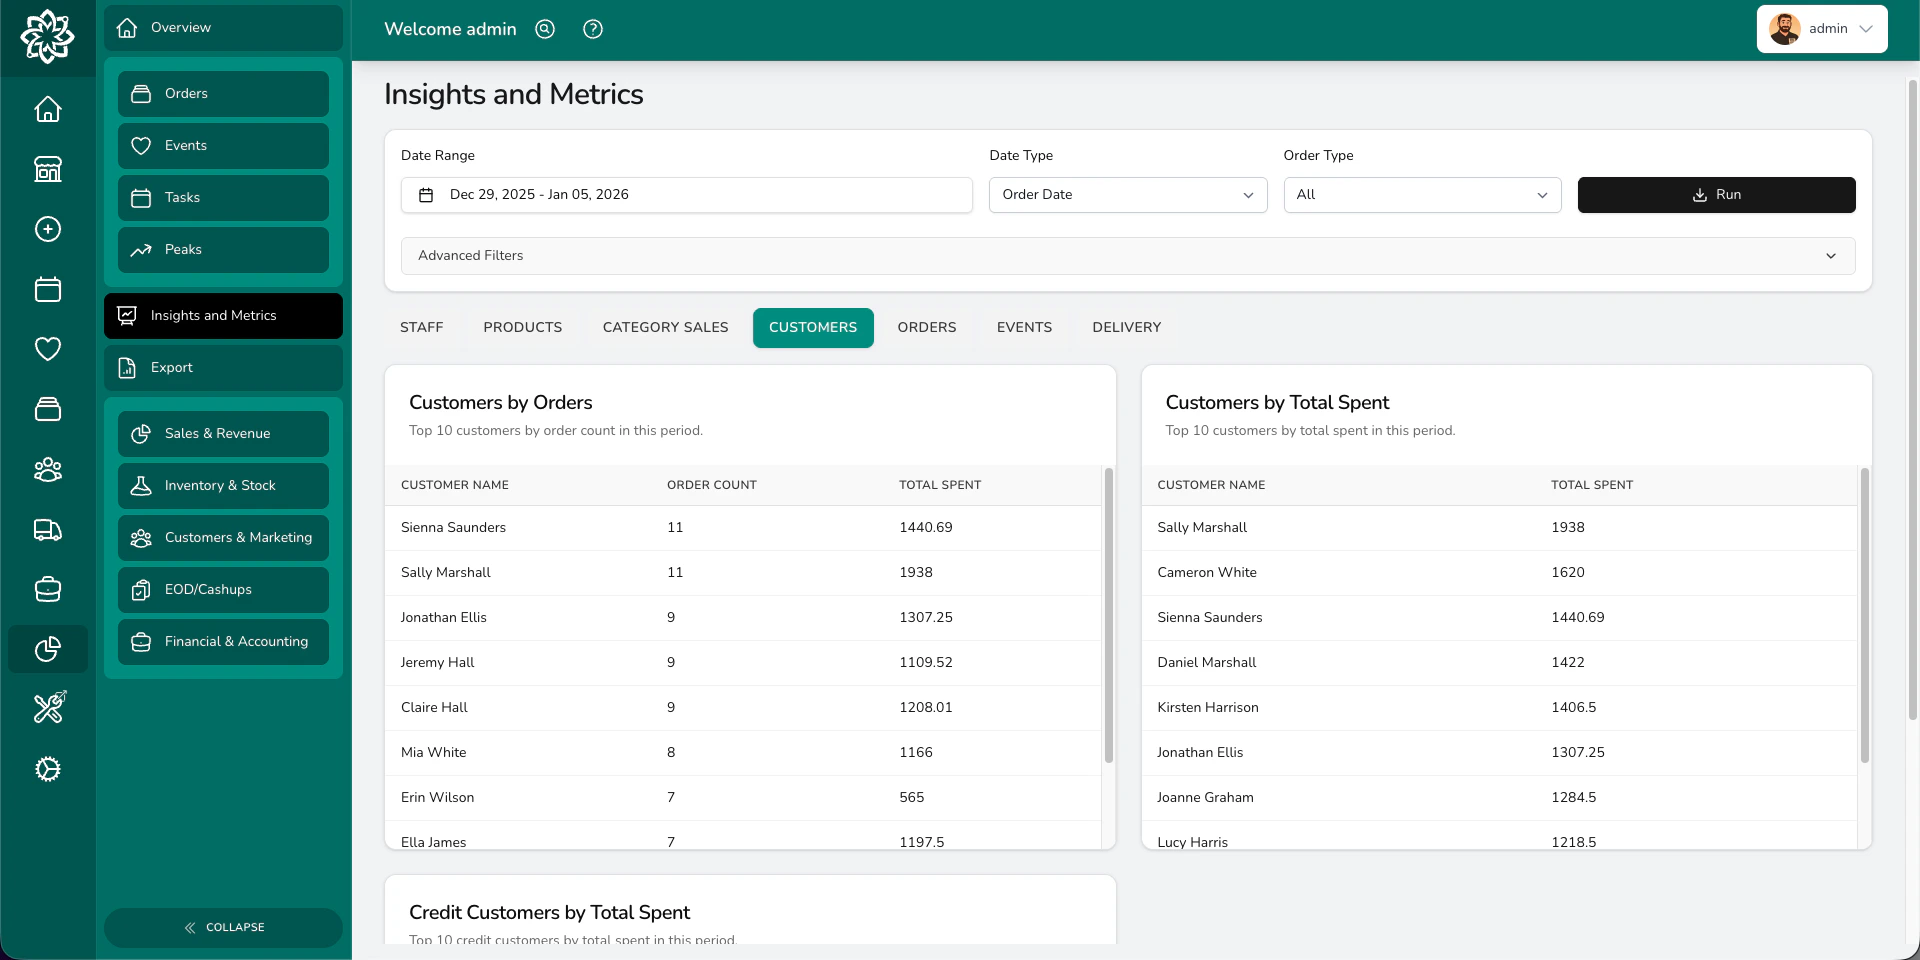
Revenue and performance broken down by your product categories. Useful for spotting which parts of your range are growing and which are declining.Customers
Learn about who’s buying from you:- Customer acquisition — how many new customers you’re gaining
- Customer retention — how many are coming back
- Lifetime value — how much each customer is worth over time
- Returning customer rates — what percentage of orders are from repeat customers
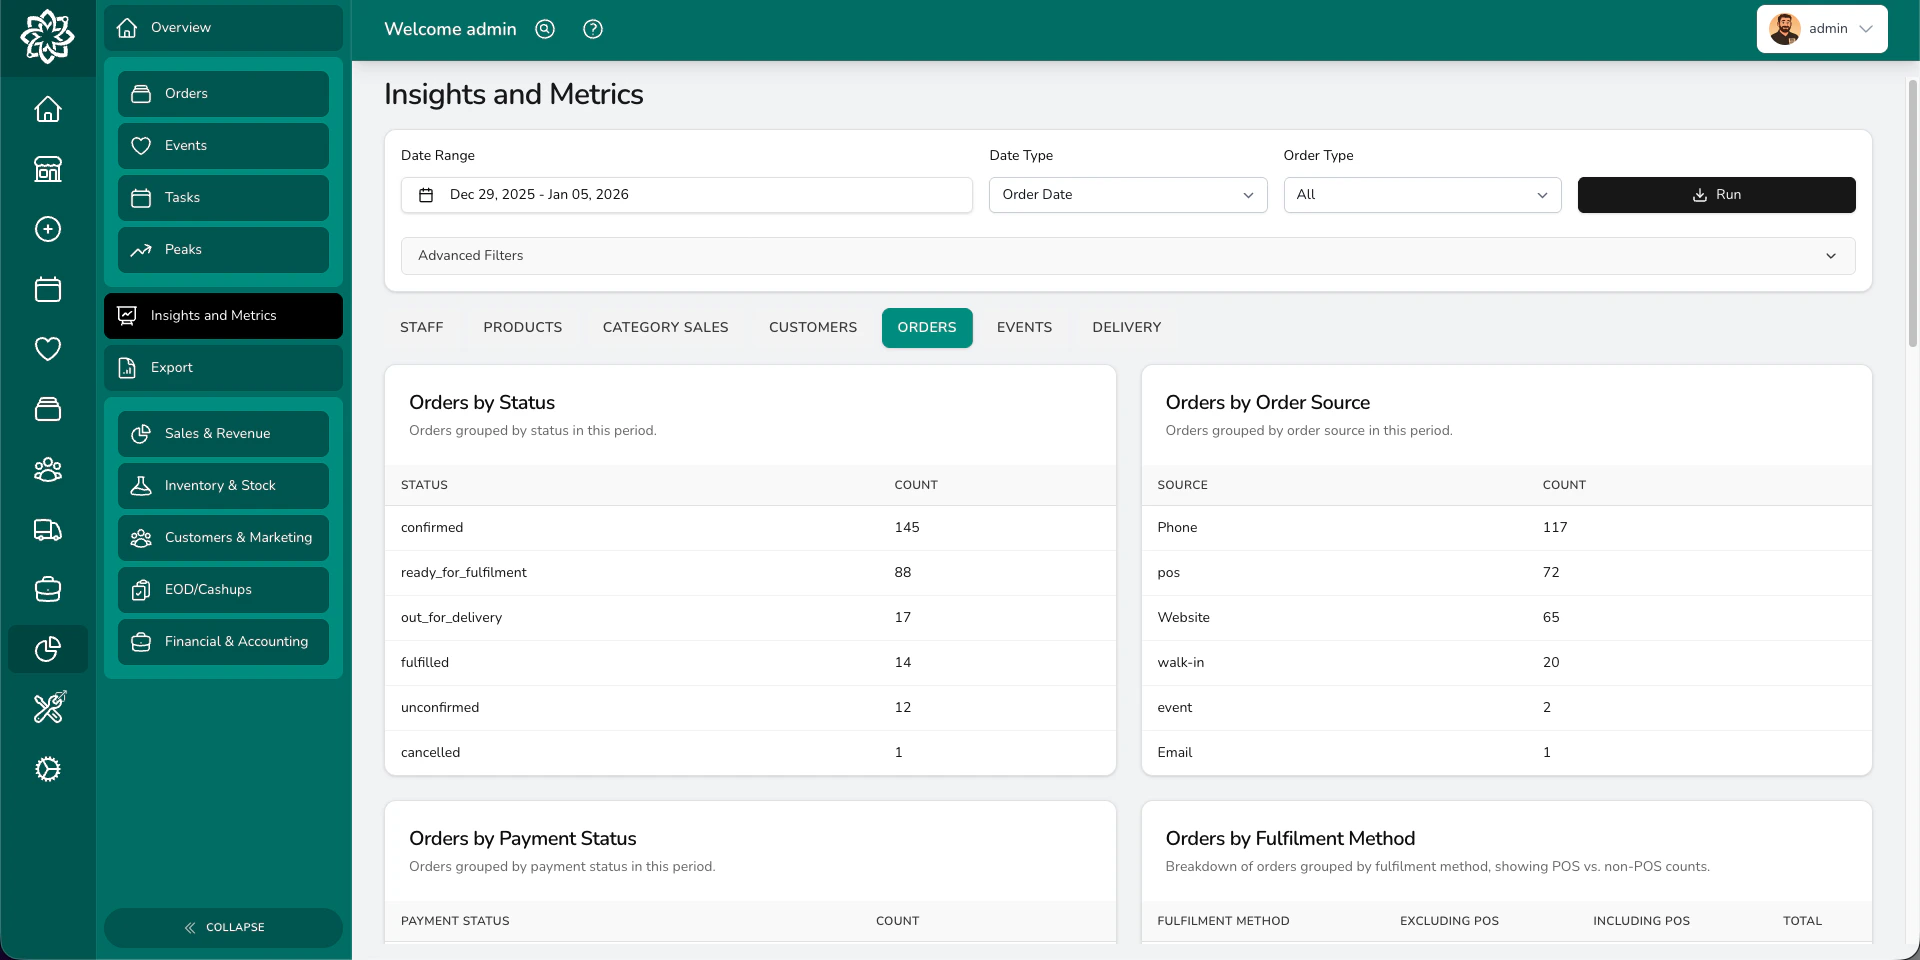
Orders
Dig into your order data:- Processing time — how long orders take from creation to fulfilment
- Volume trends — order counts over time
- Status distribution — where orders are in the pipeline
- Quote conversion — how many quotes become confirmed orders
- Payment collection — tracking payments received vs outstanding
- Occasion analysis — which occasions drive the most orders
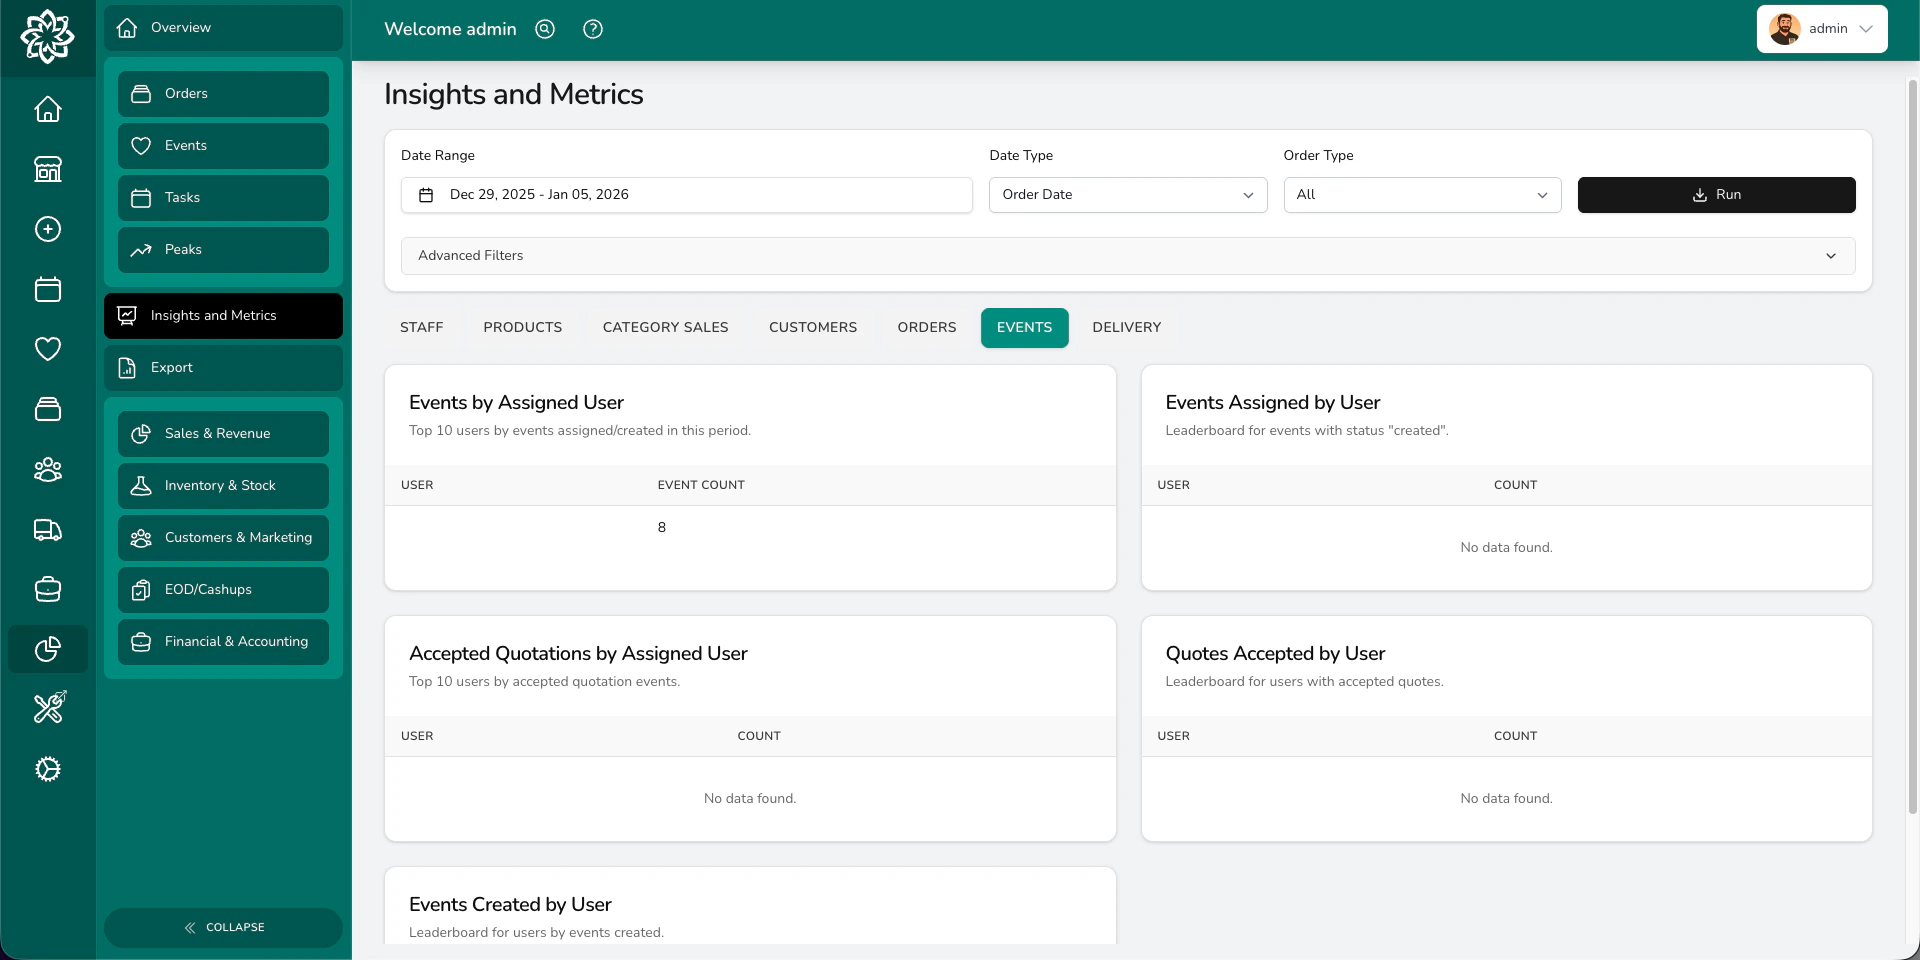
Events
Track your wedding and event business:- Event revenue trends — how event income is changing over time
- Event volume — how many events you’re booking
- Status tracking — how events move through your pipeline
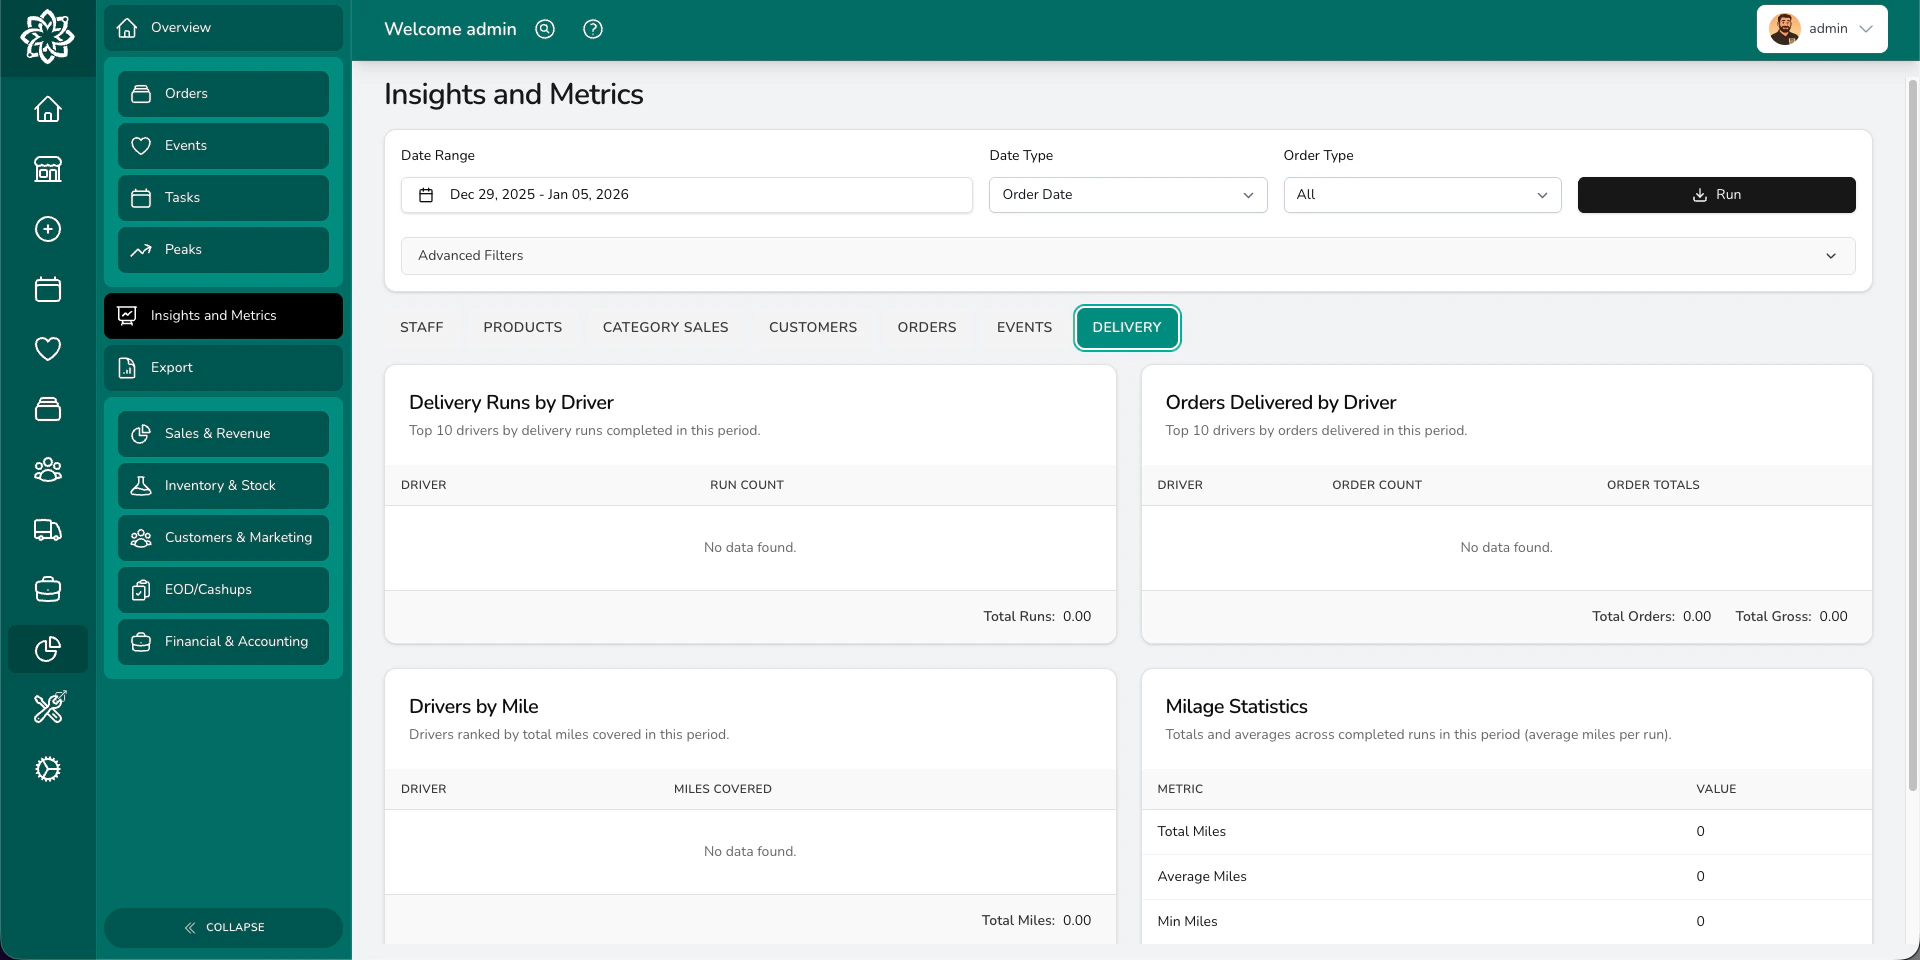
Delivery
Monitor your delivery performance:- Punctuality — are deliveries arriving on time?
- Performance by location — how each shop’s deliveries compare
- Method breakdown — delivery vs collection vs courier trends
Filtering
Use the filters at the top of the page to refine what you see:- Date range — pick a preset (last 7 days, this month, last year, etc.) or choose custom dates
- Date type — switch between order date and fulfilment date
- Order type — all orders, or filter to gift, funeral, corporate, or event
- Locations — view one shop or all
- Integrations — filter by connected platforms
- Order sources — filter by where orders came from
- Product categories — focus on specific categories (you can include subcategories too)
Date presets include: Today, Last 7 days, Last 30 days, This month, Last month, This year, and Last year. Pick the one that makes sense for what you’re investigating.
Common questions
Can I export insights data?
Can I export insights data?
Some insights blocks have an export option. For full data downloads, head to Reports.
Why do some blocks not show anything?
Why do some blocks not show anything?
If a block has no data for your selected filters and date range, it won’t appear. Try widening your date range or removing filters.
What's the difference between insights and reports?
What's the difference between insights and reports?
Insights are visual — charts and tables on screen. Reports are downloadable spreadsheets with raw data you can open in Excel or Google Sheets.
What’s next?
Analytics
Back to the analytics overview.
Peak Reporting
Compare your busiest periods year-on-year.
Reports
Download detailed reports as spreadsheets.
Products
Manage the products that appear in your insights.